King Tides Home | How to Participate | About King Tides | Educator Resources
Join #KingTides on social media:
![]()
![]()
![]()
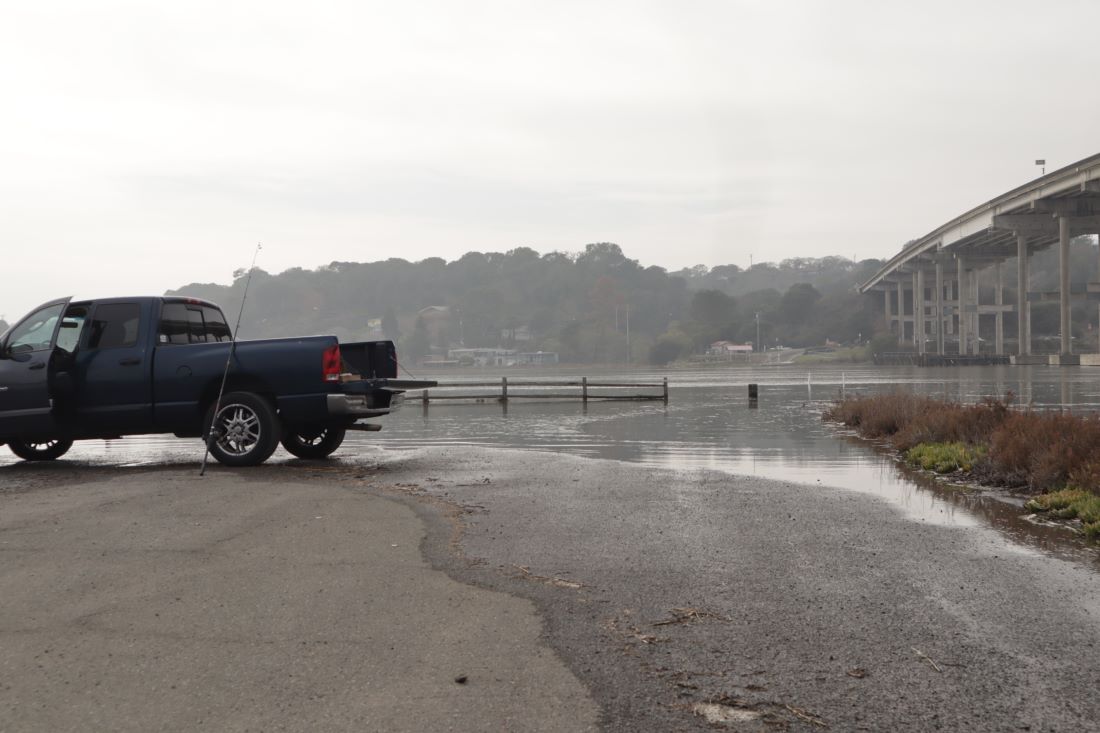
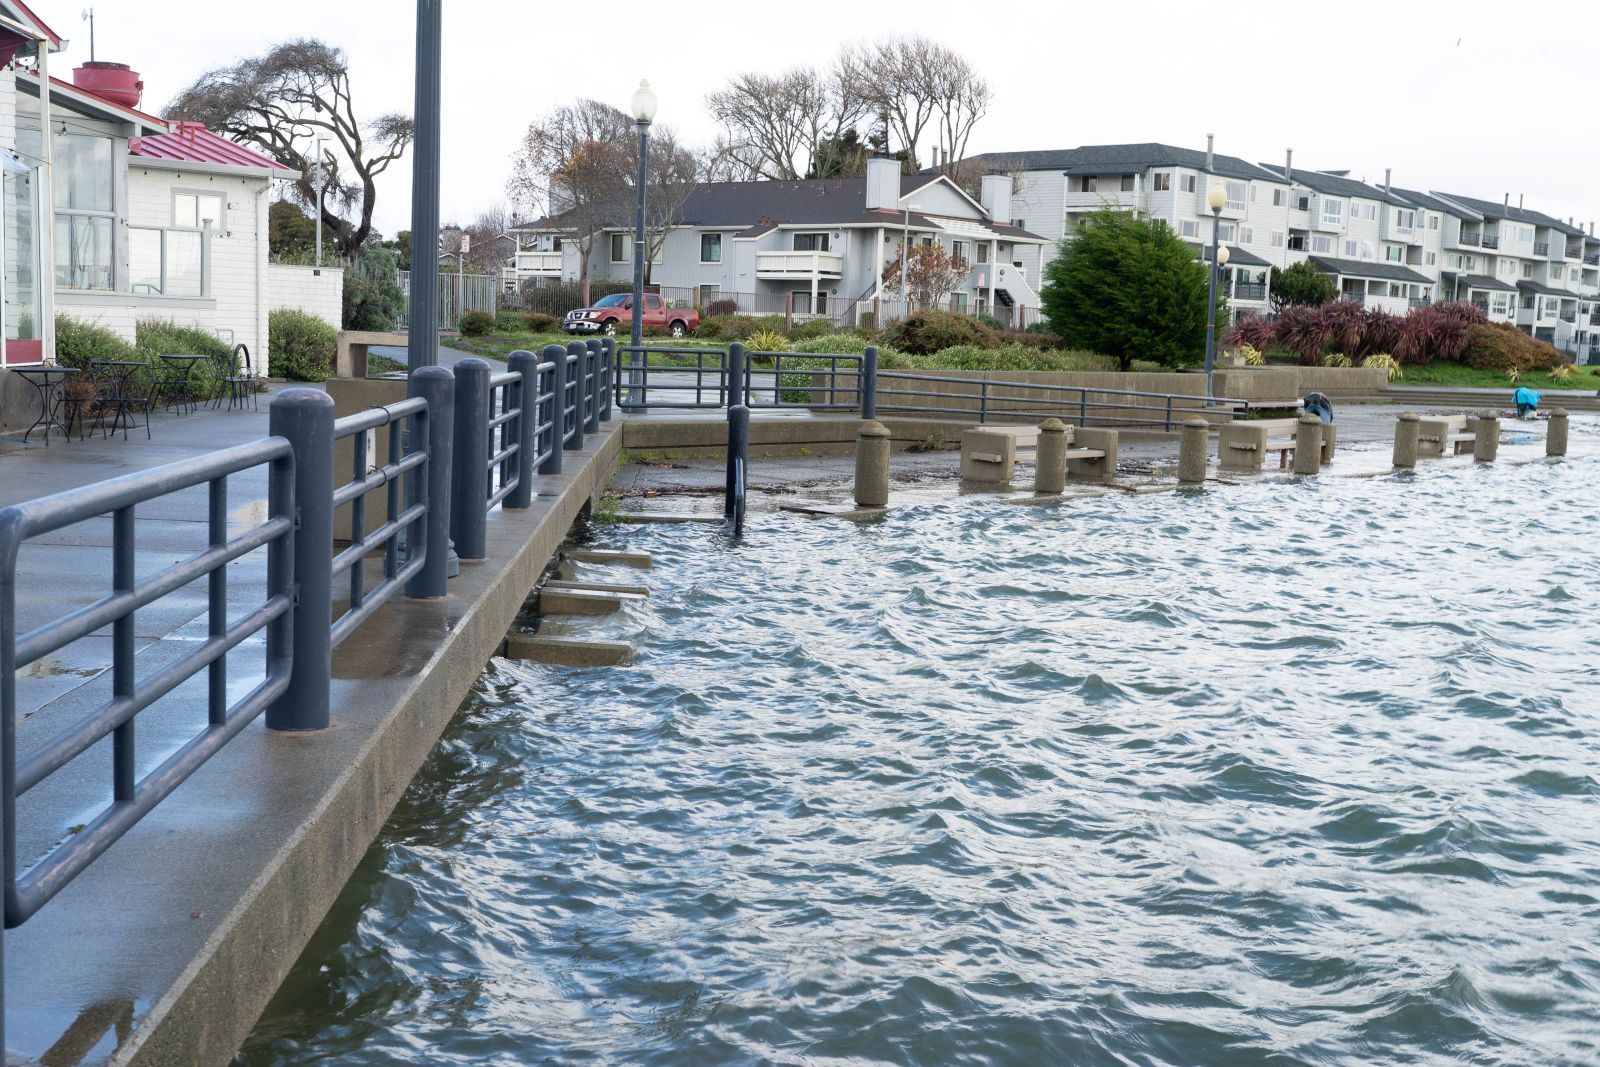
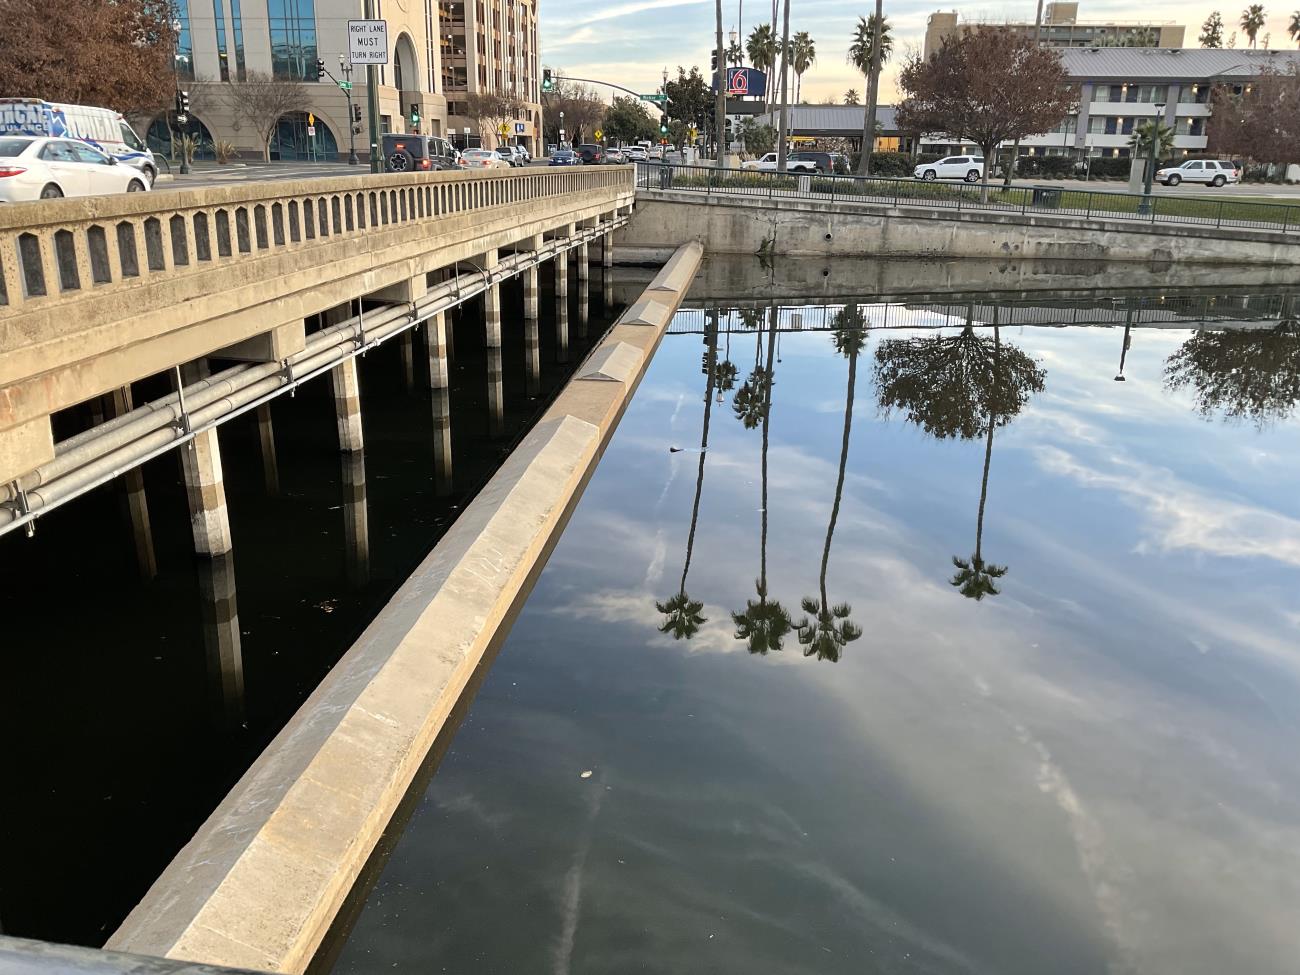
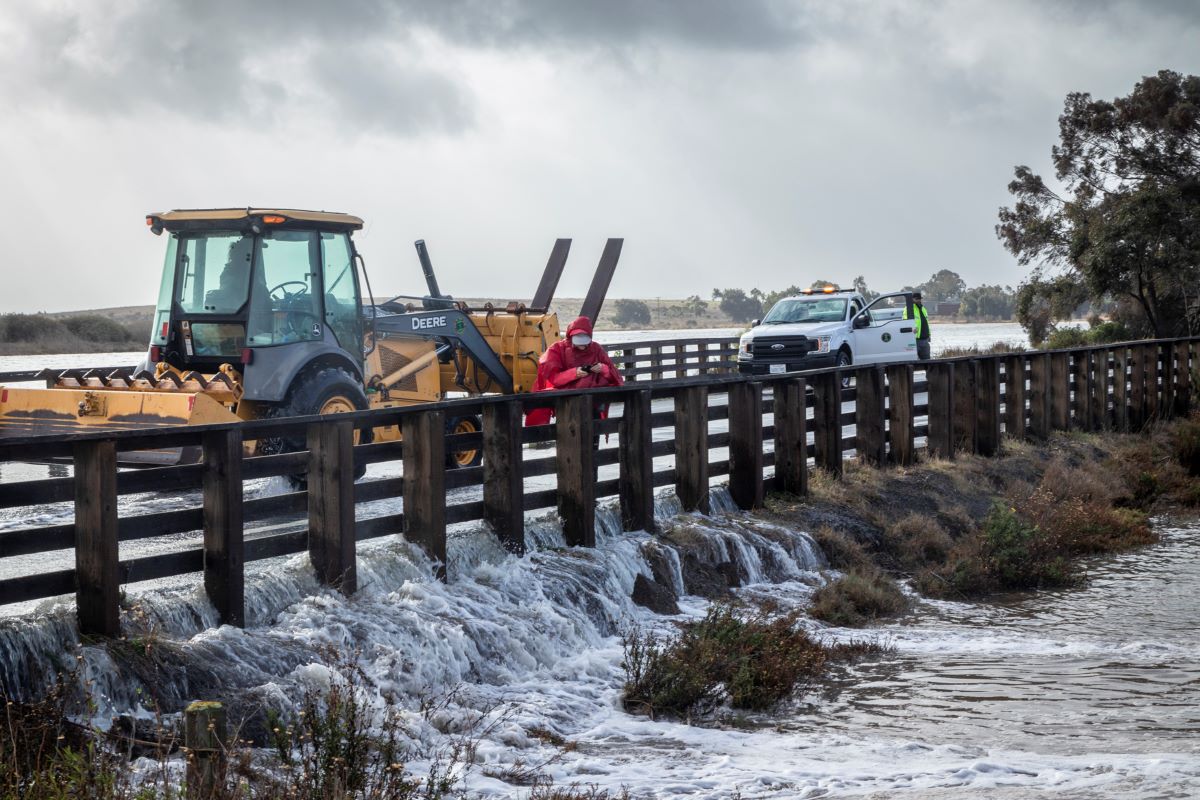
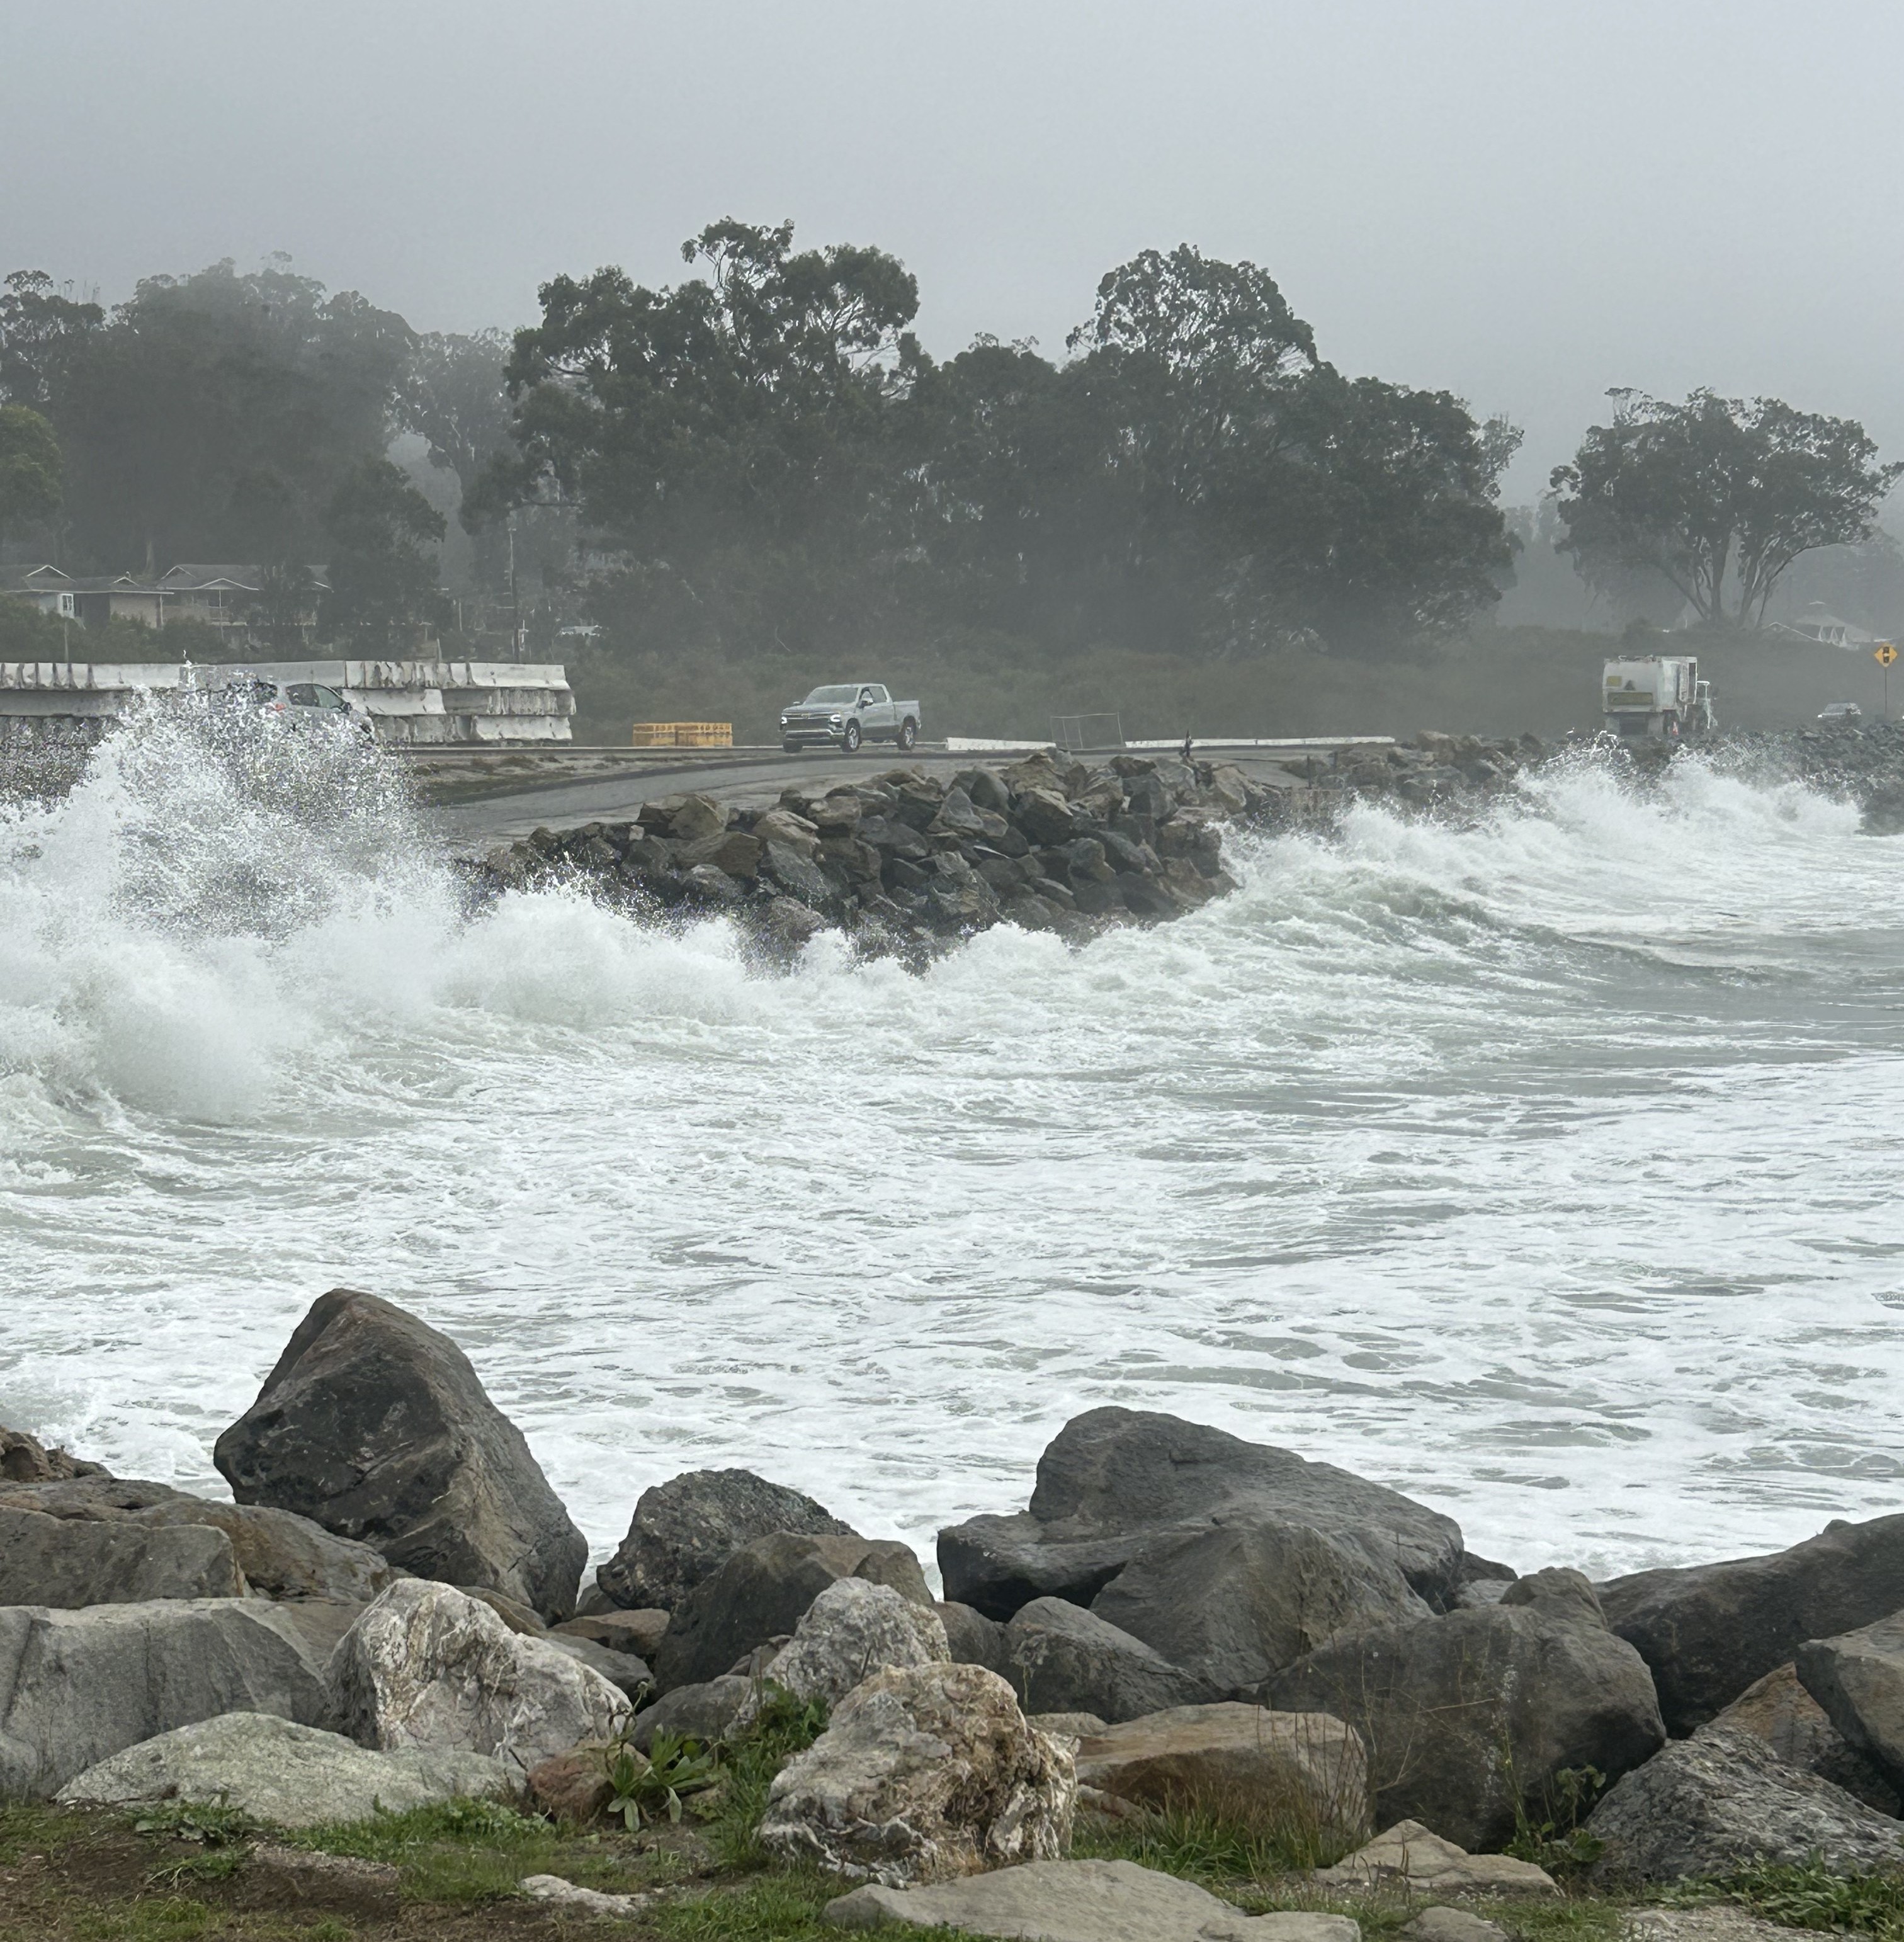
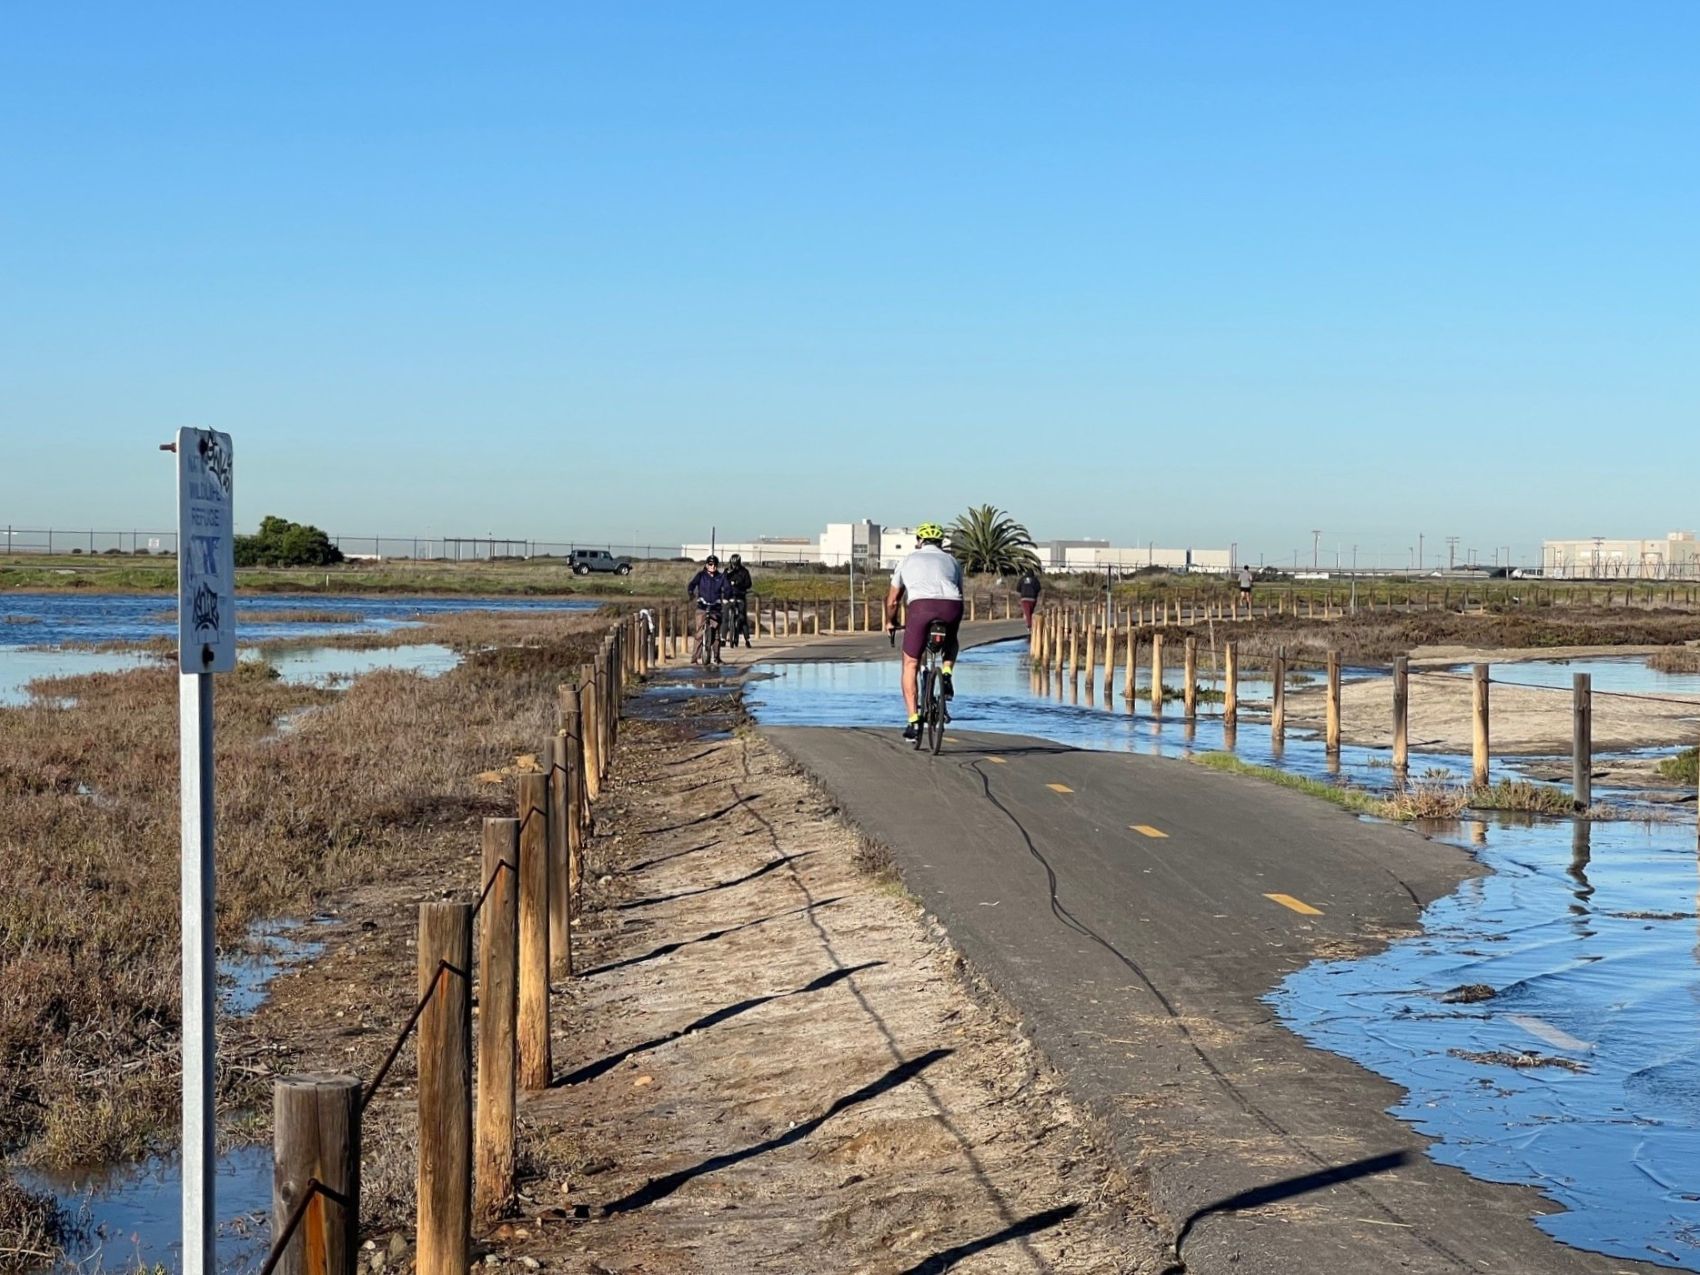
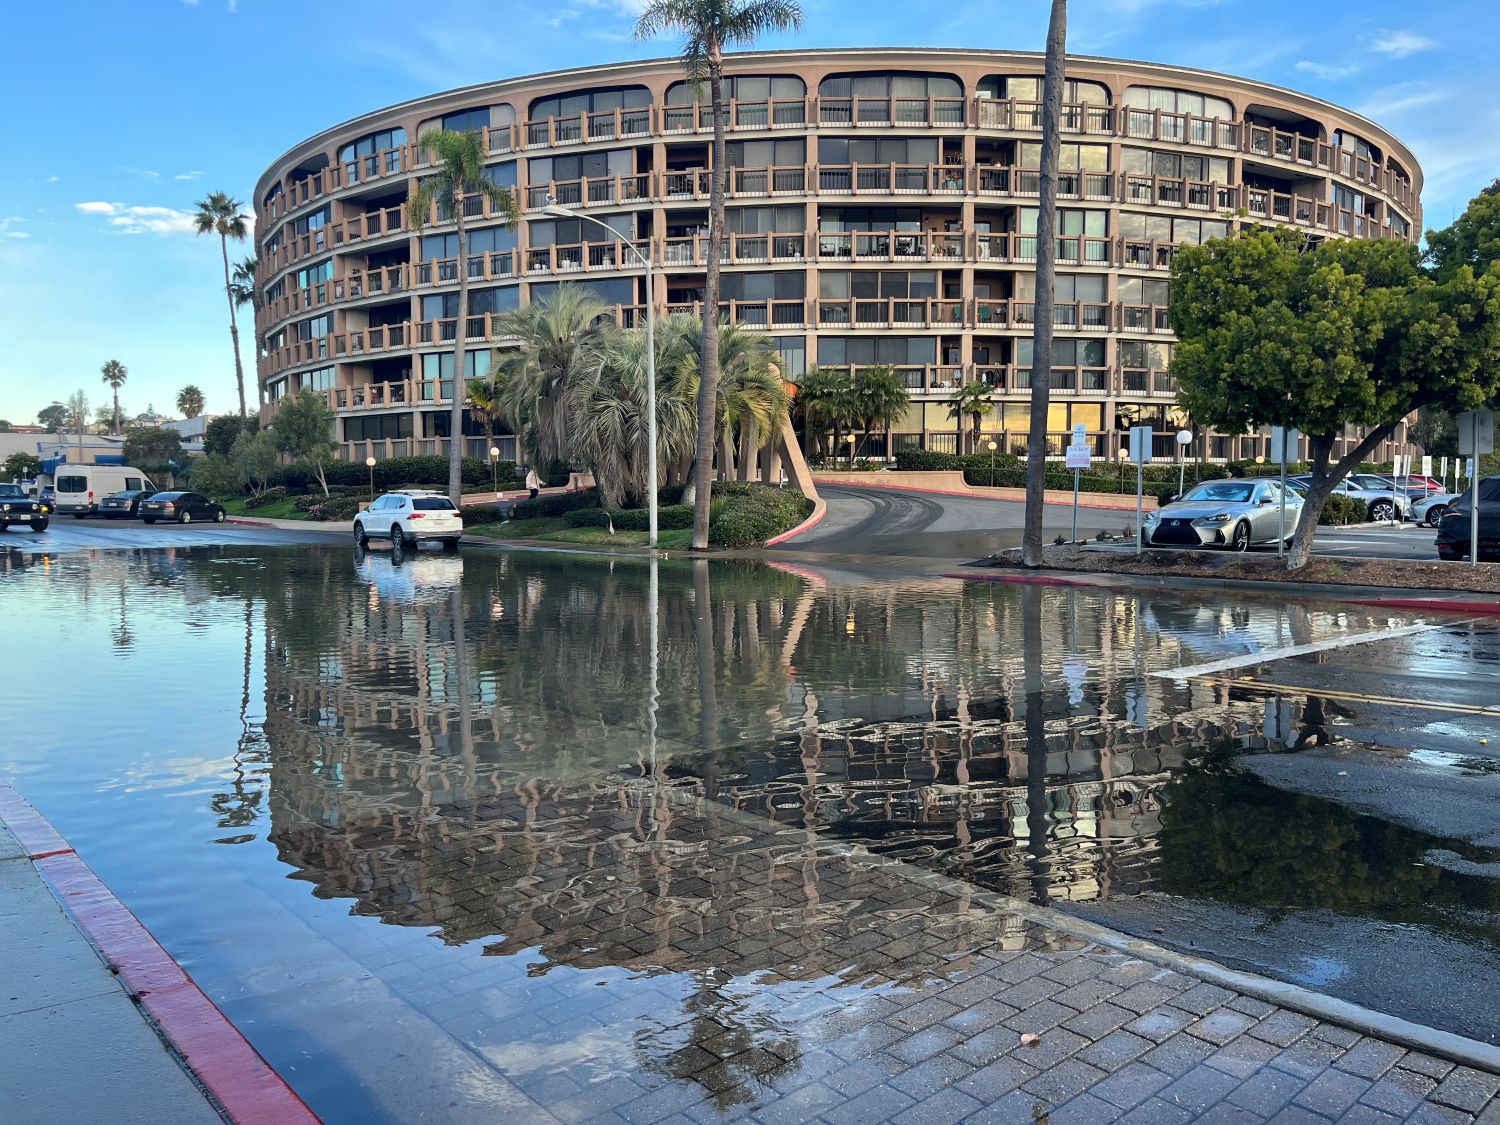
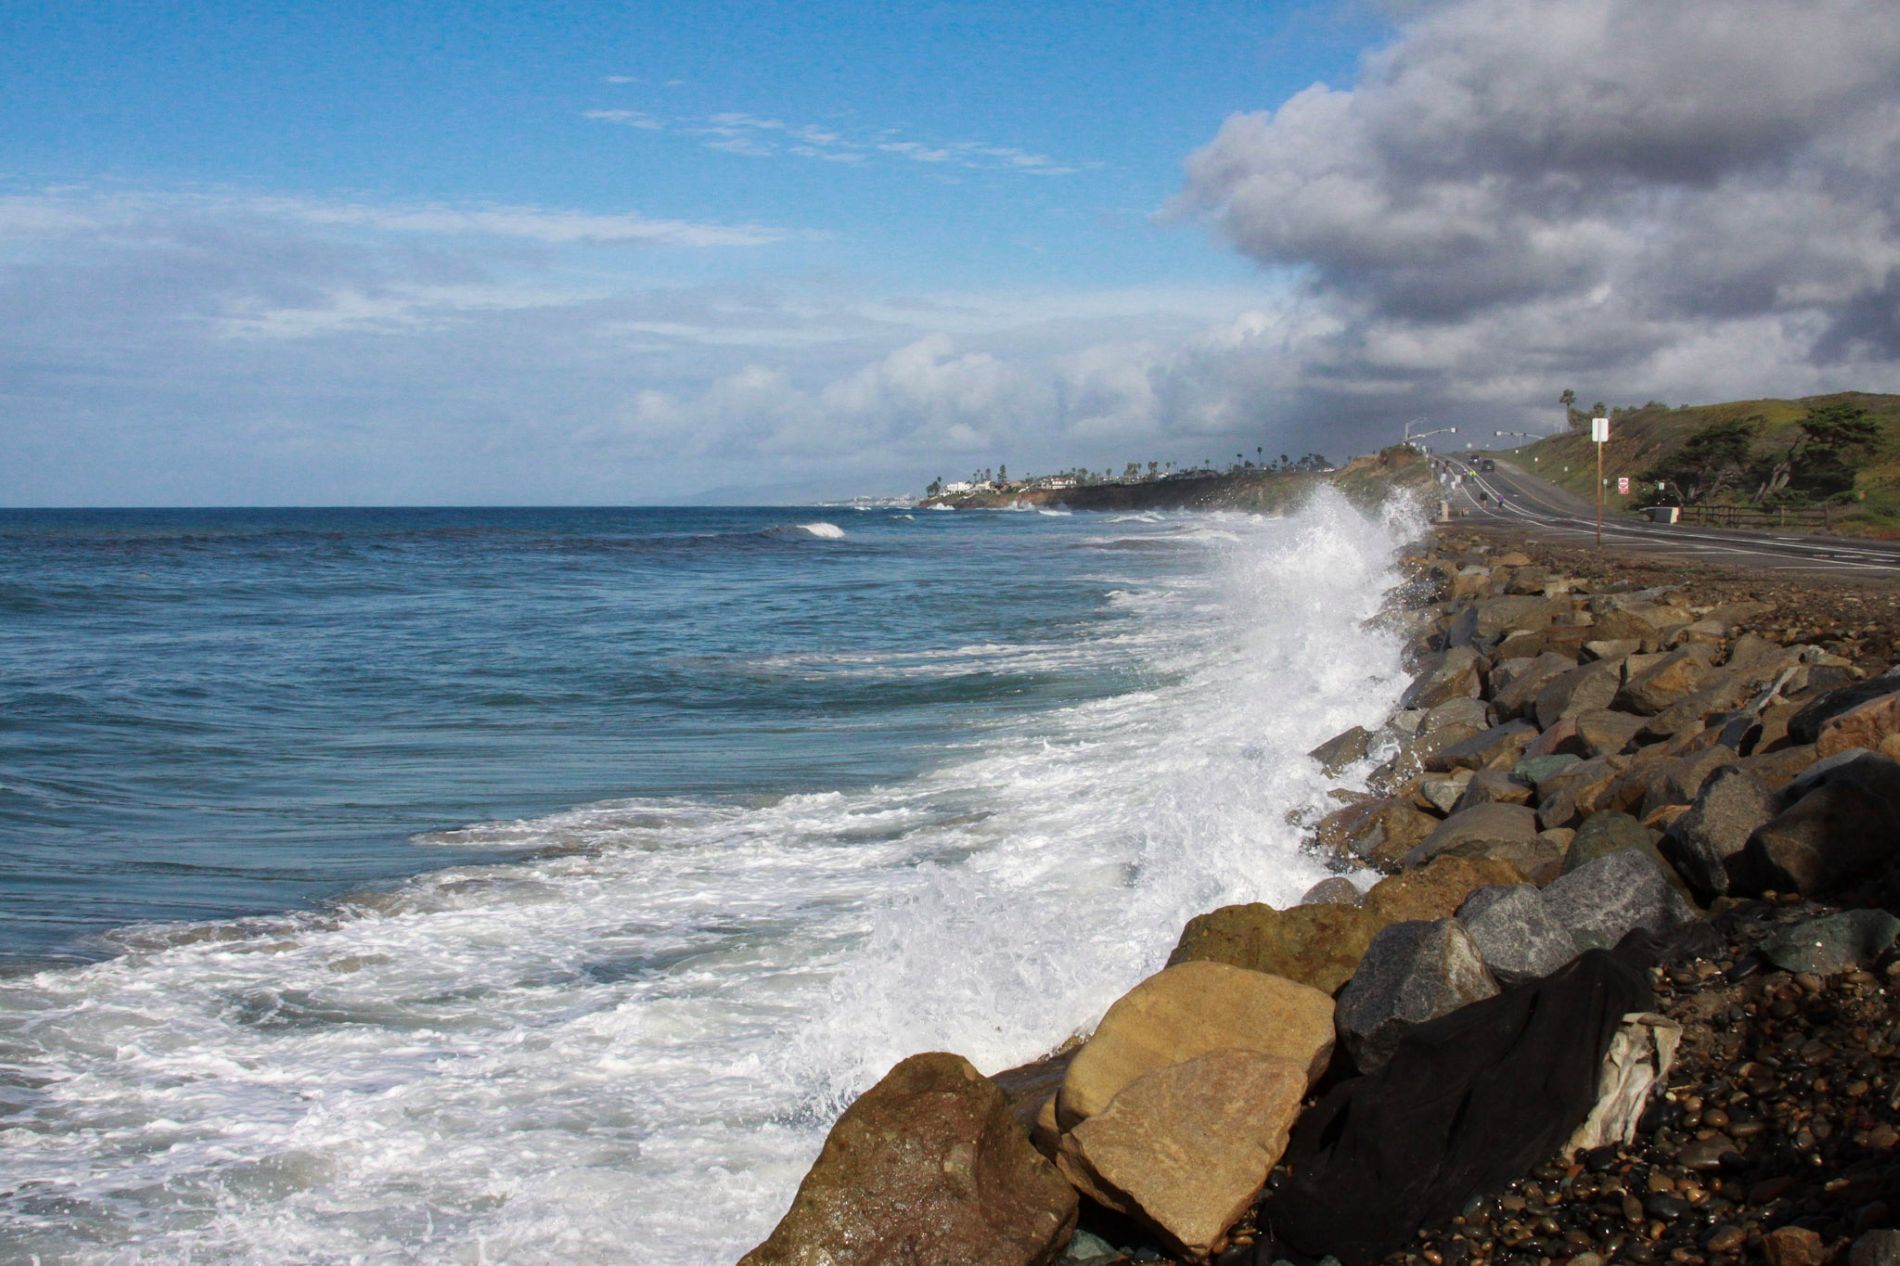
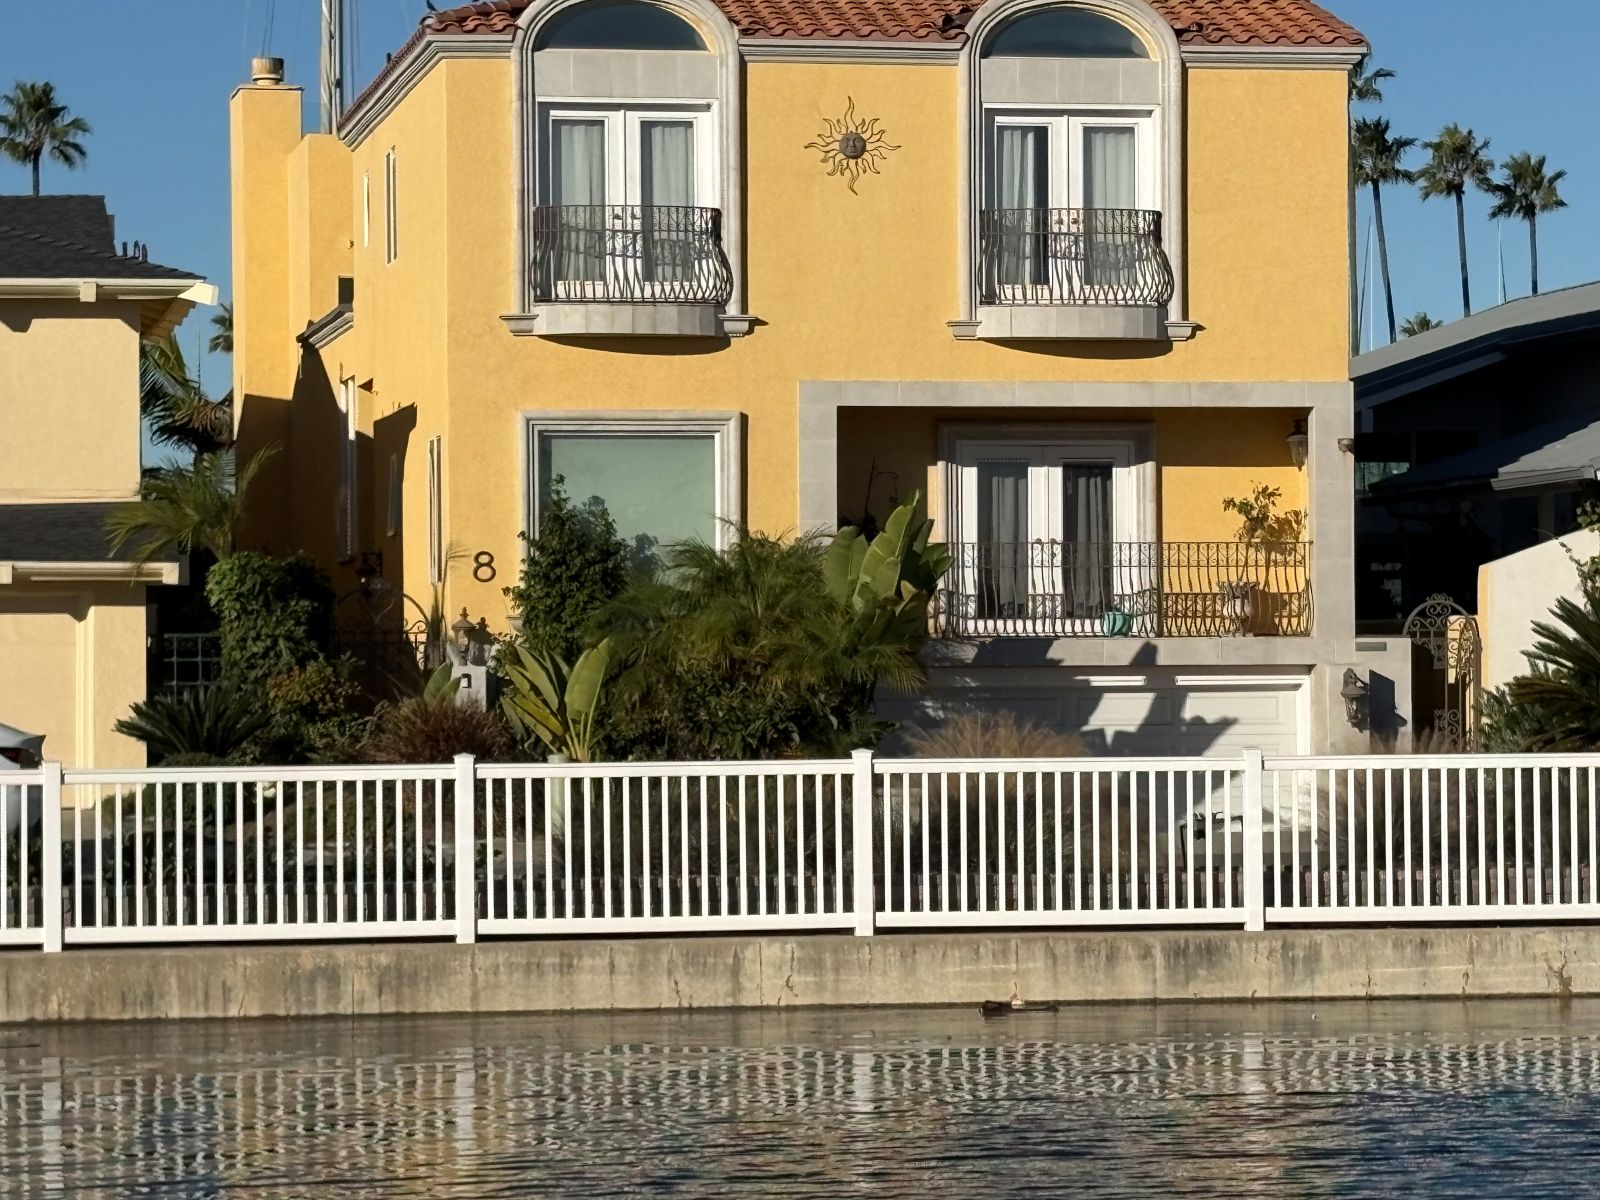
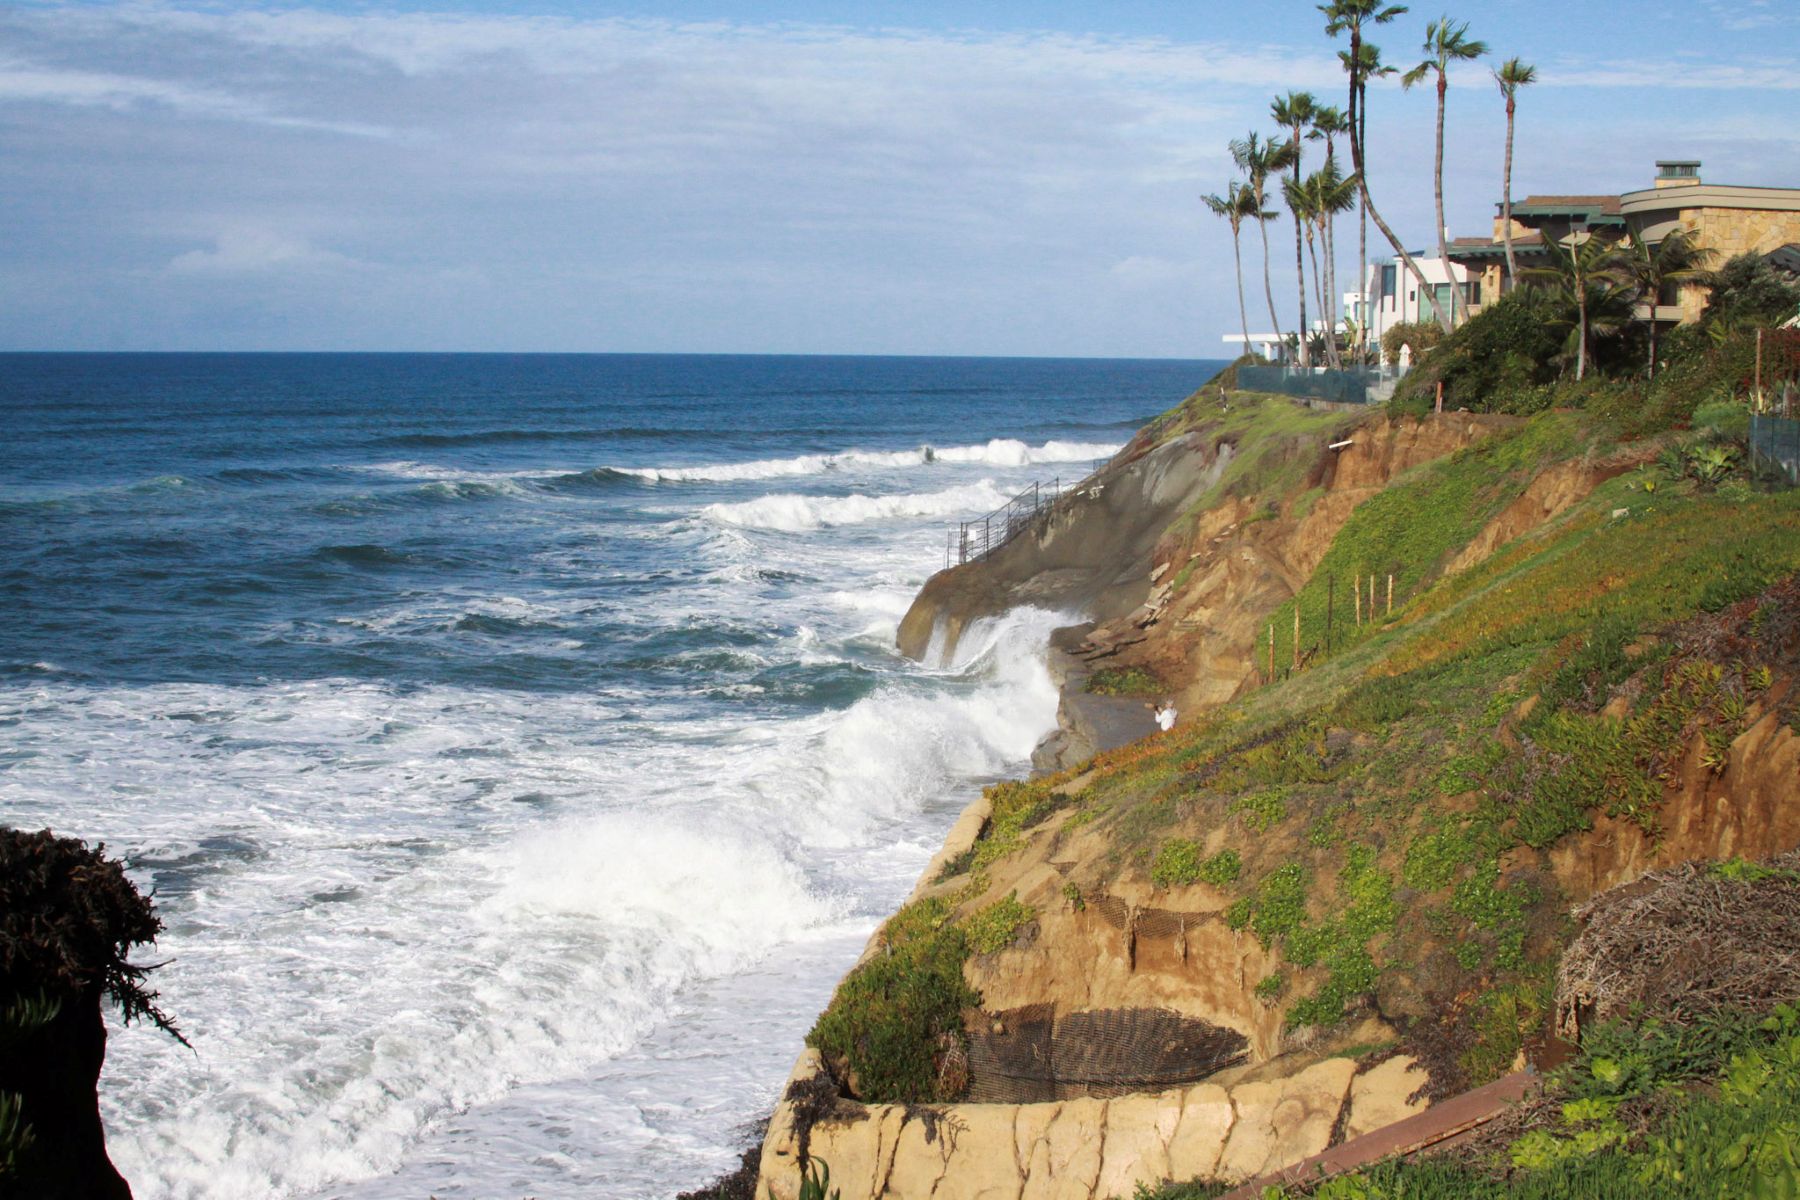
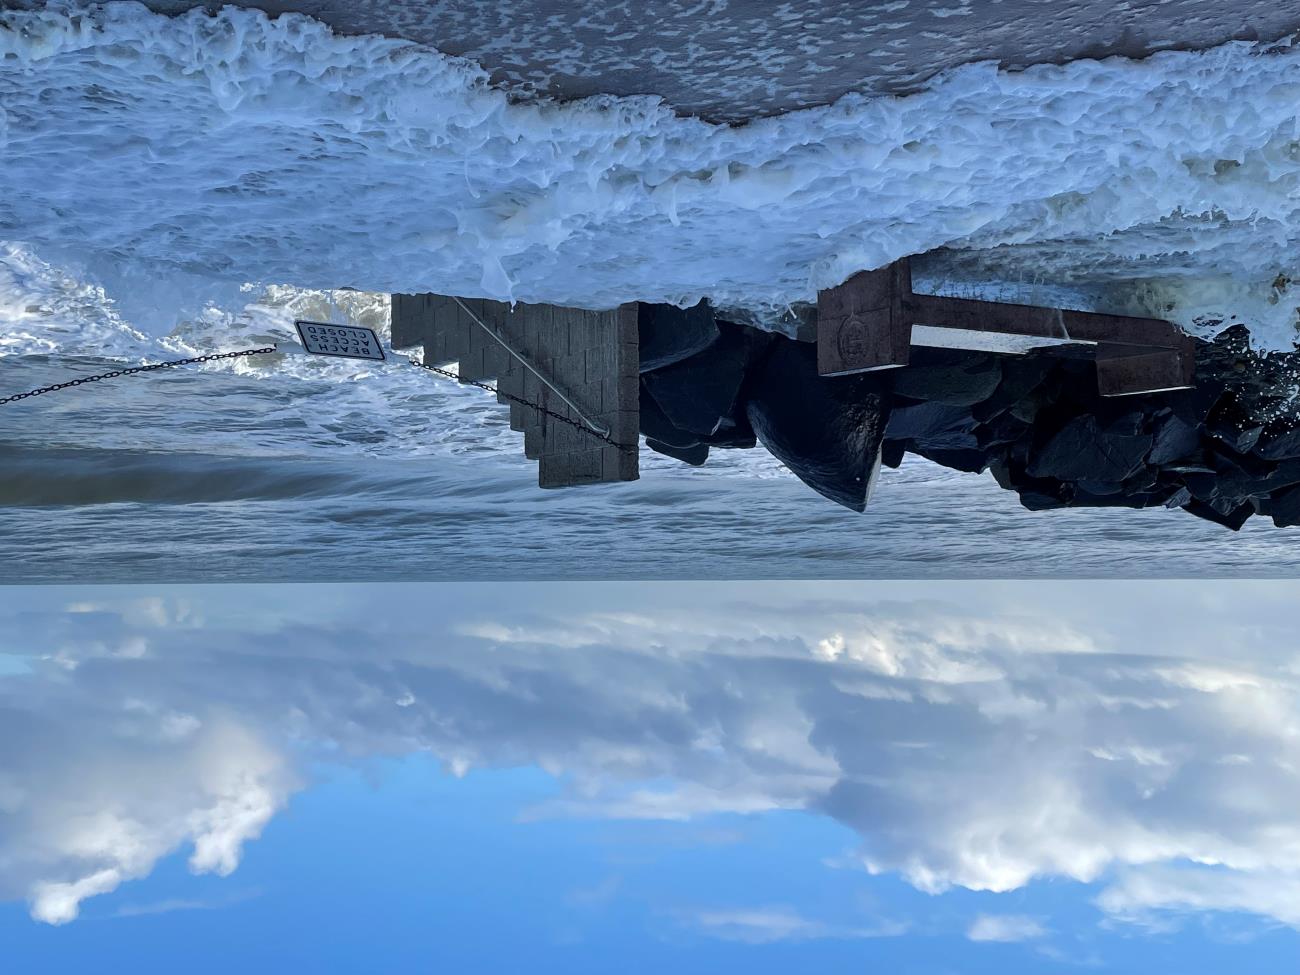
Since 2010, people have joined the California King Tides Project in taking and sharing photos of the highest high tides of the year and their impact on the shore. Starting with the 2018/2019 season, photos are compiled in an interactive online map, presenting a geographic view of this community science data. You can also search for #kingtides on social media platforms and view a small selection of photos from recent years organized by county below.
Click on photos below to enlarge. Thousands more photos are available on the photo map, where you may also find larger versions of the photos below. All photos are available for use by the public. Thank you for crediting the California King Tides Project in your use of these photos.
Del Norte - Humboldt - Mendocino - Sonoma – Marin – Solano – Contra Costa – San Joaquin County - Alameda – San Francisco – Santa Clara – San Mateo – Santa Cruz – Monterey – San Luis Obispo – Santa Barbara – Ventura – Los Angeles – Orange – San Diego

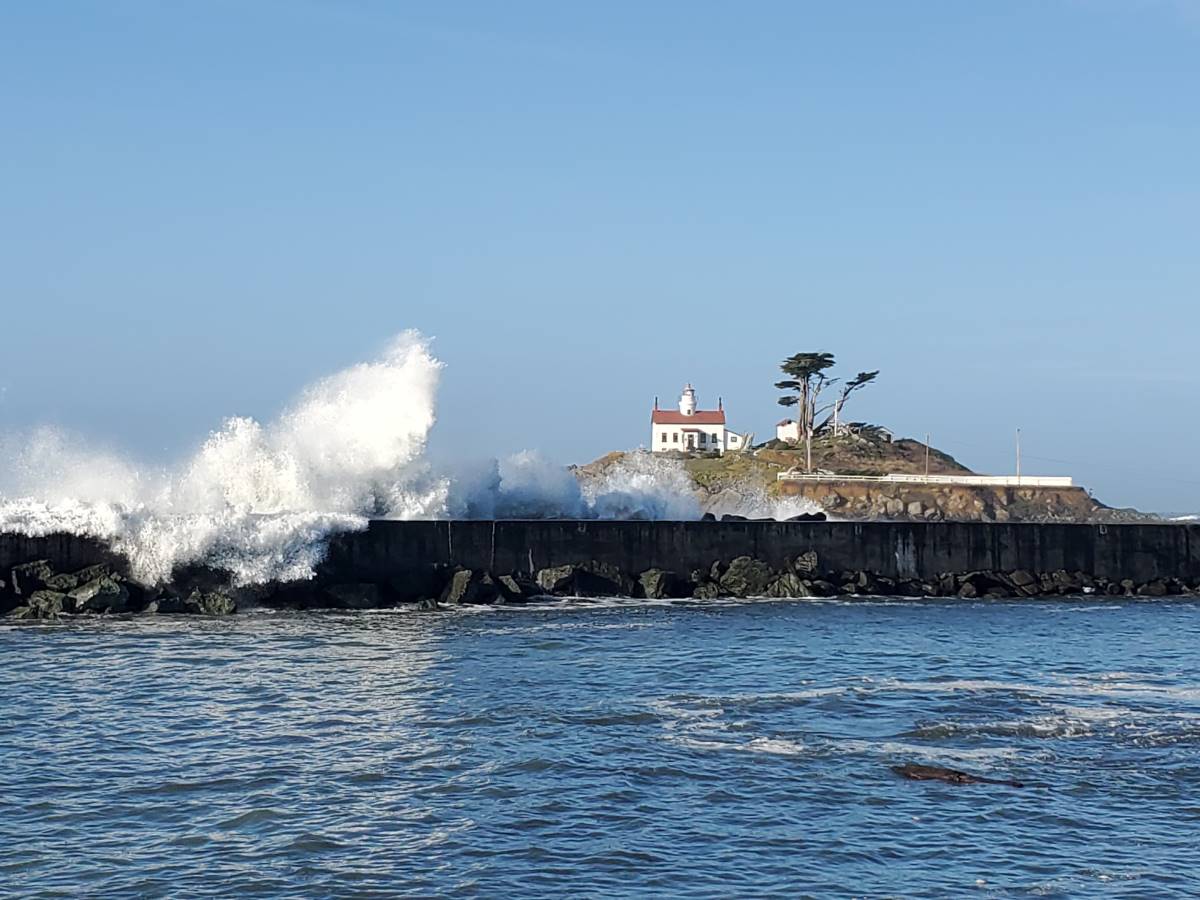
Lighthouse Jetty, Crescent City, 11/15/2024
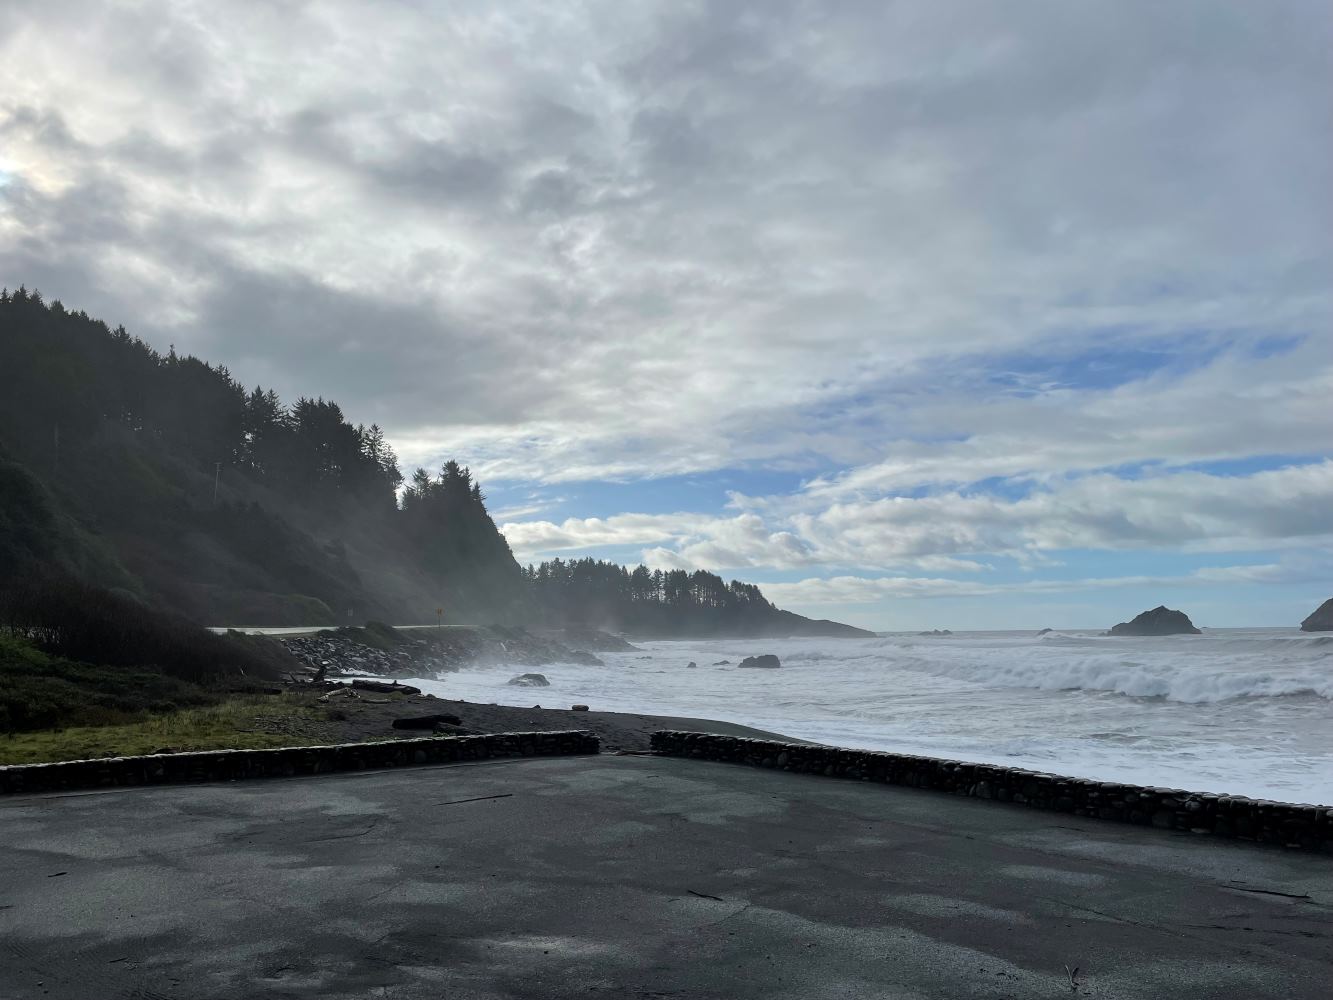
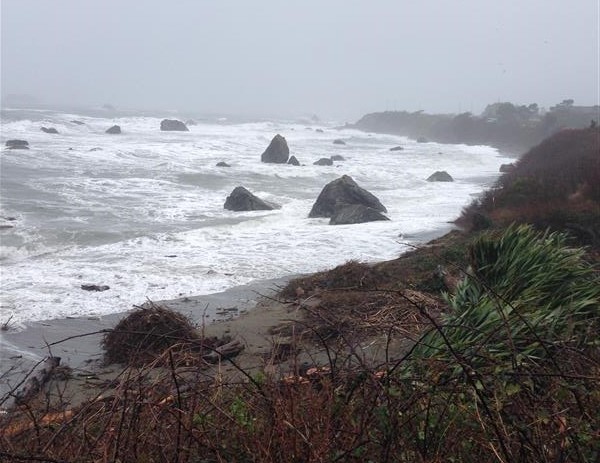
Wilson Creek Beach, Del Norte Coast Redwoods State Park, 1/11/2024
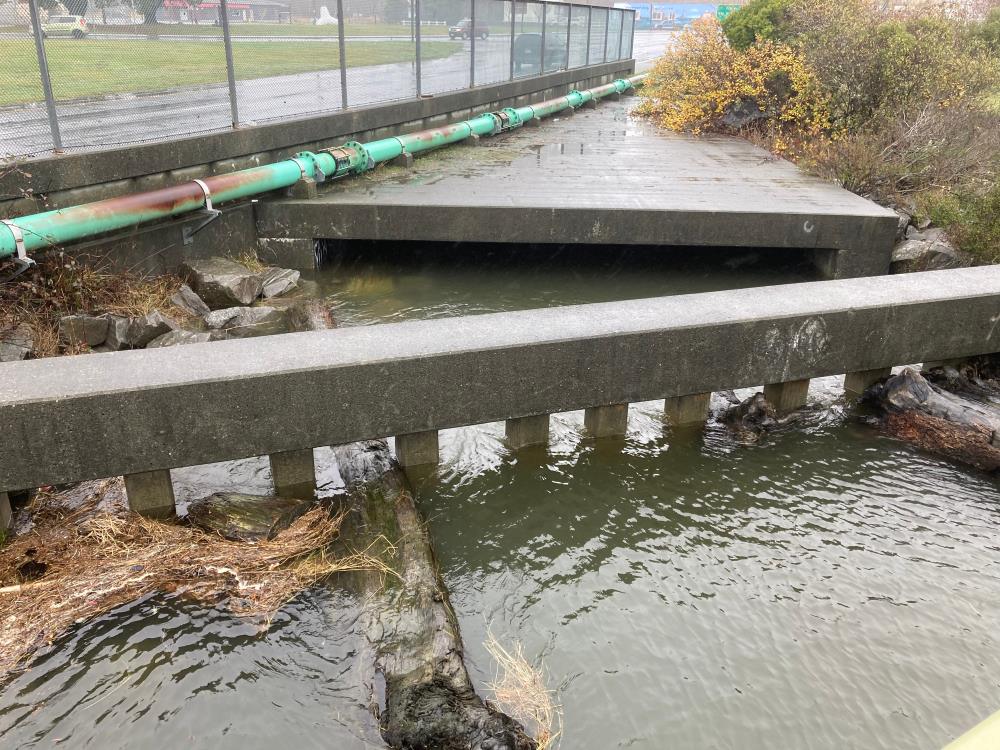
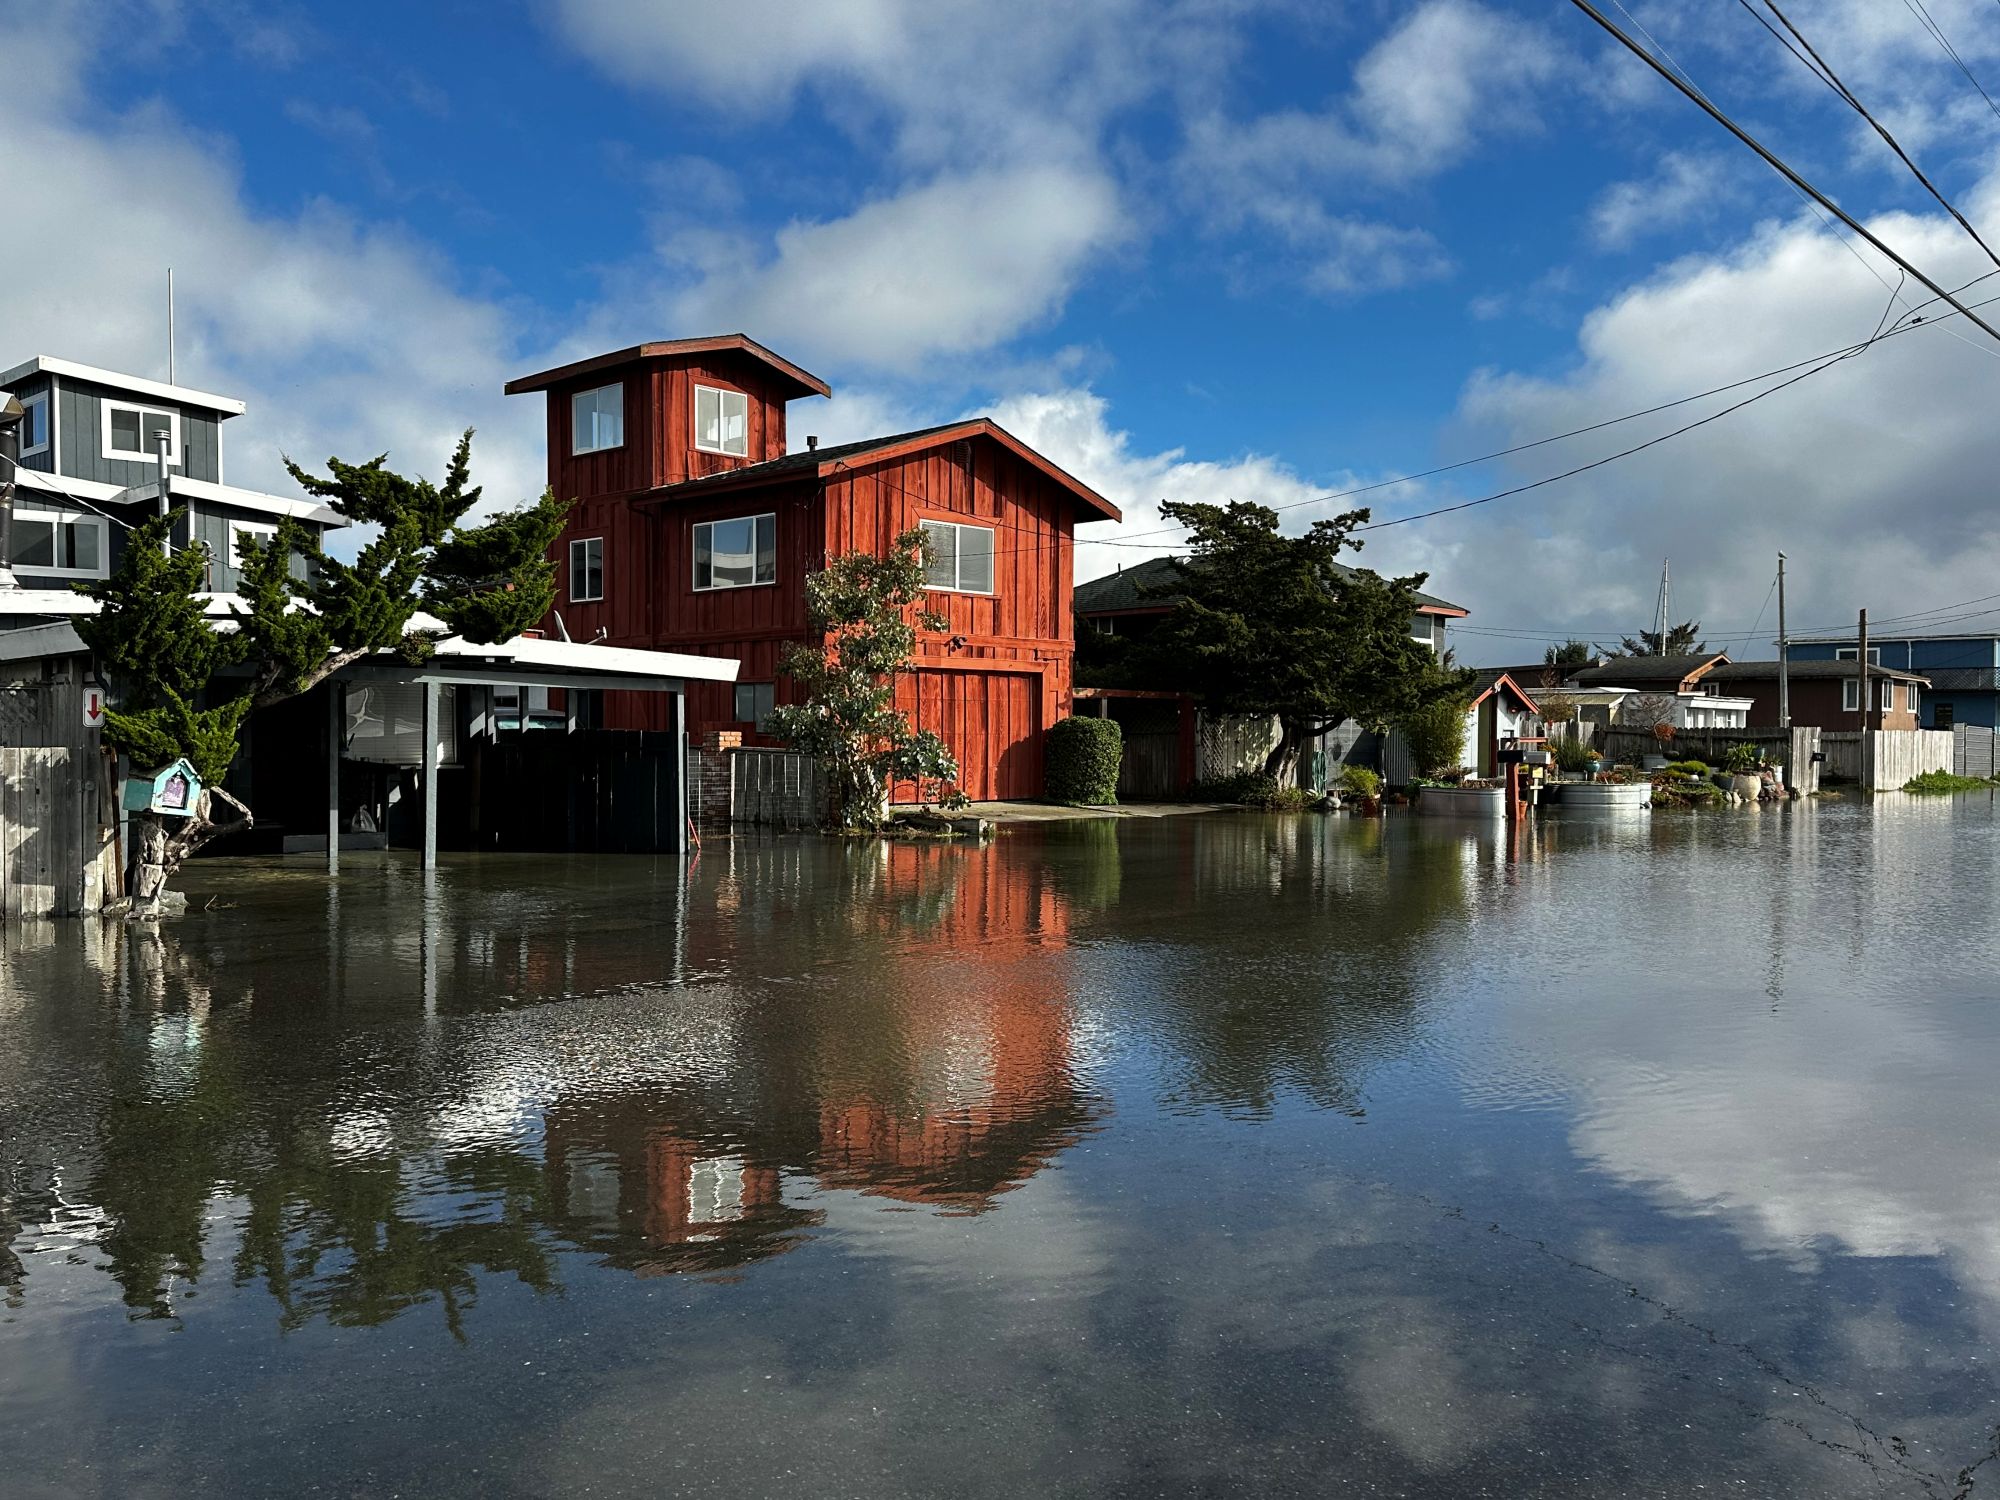
L Street near Front Street, Crescent City, 12/23/22
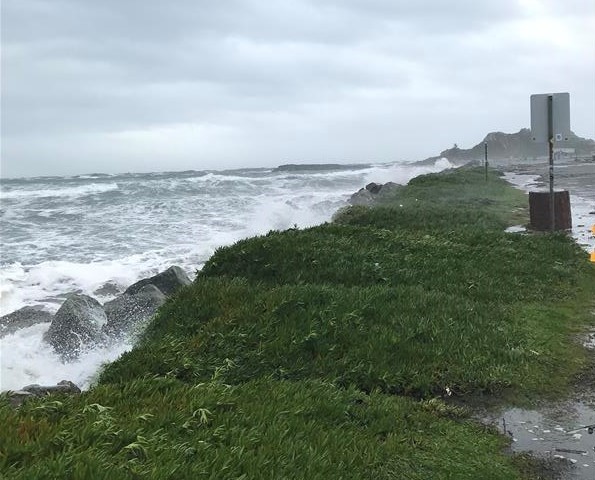
Embankment on Anchor Way, Crescent City, 1/3/2022
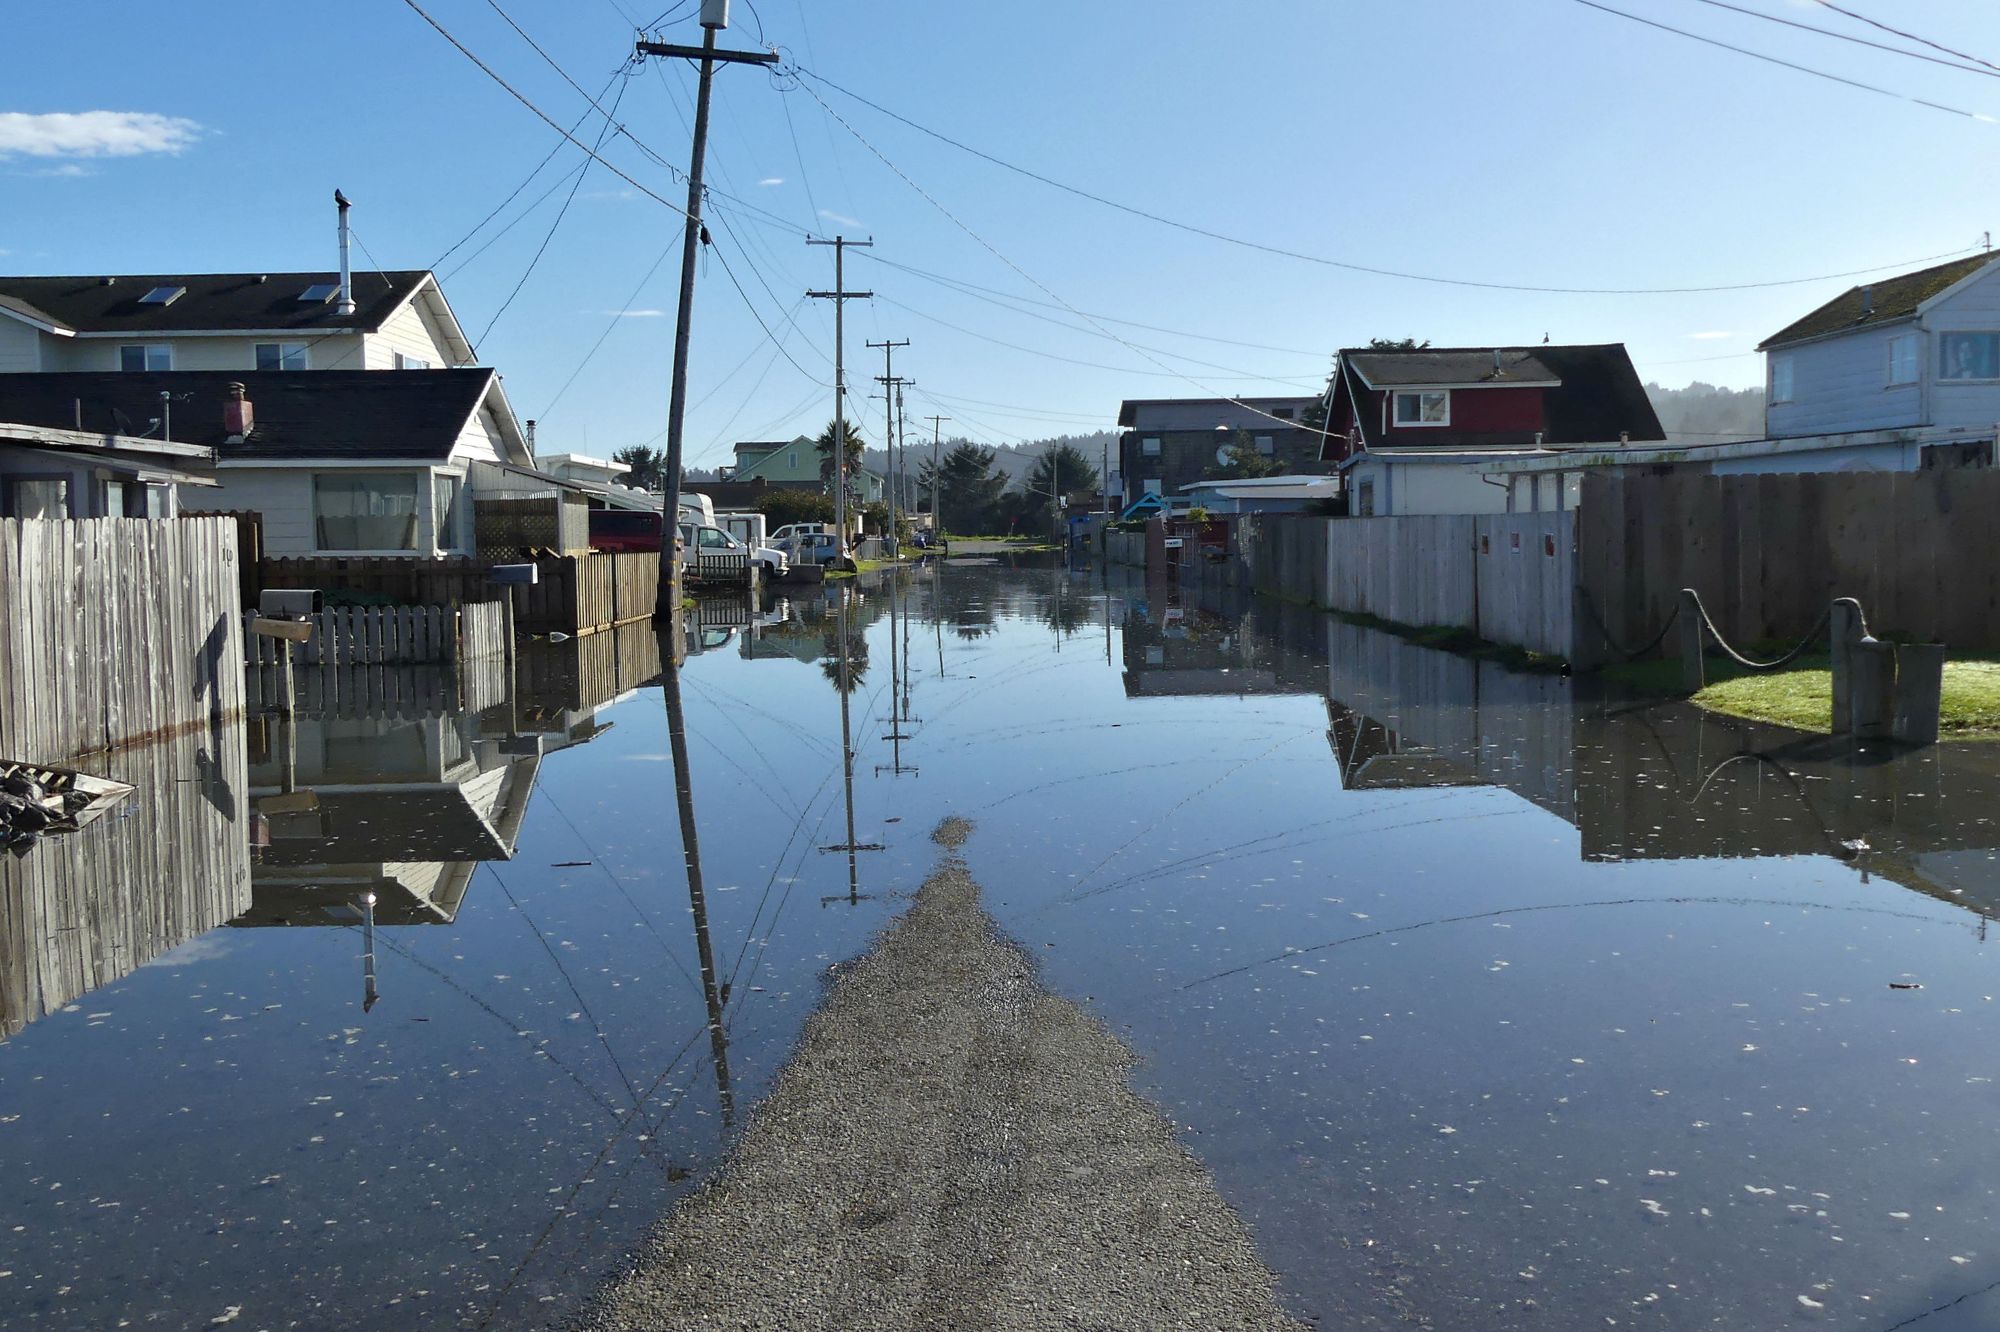
End of West 4th Street, Crescent City, 1/3/2022
Battery Point Lighthouse, Crescent City, 12/14/2020
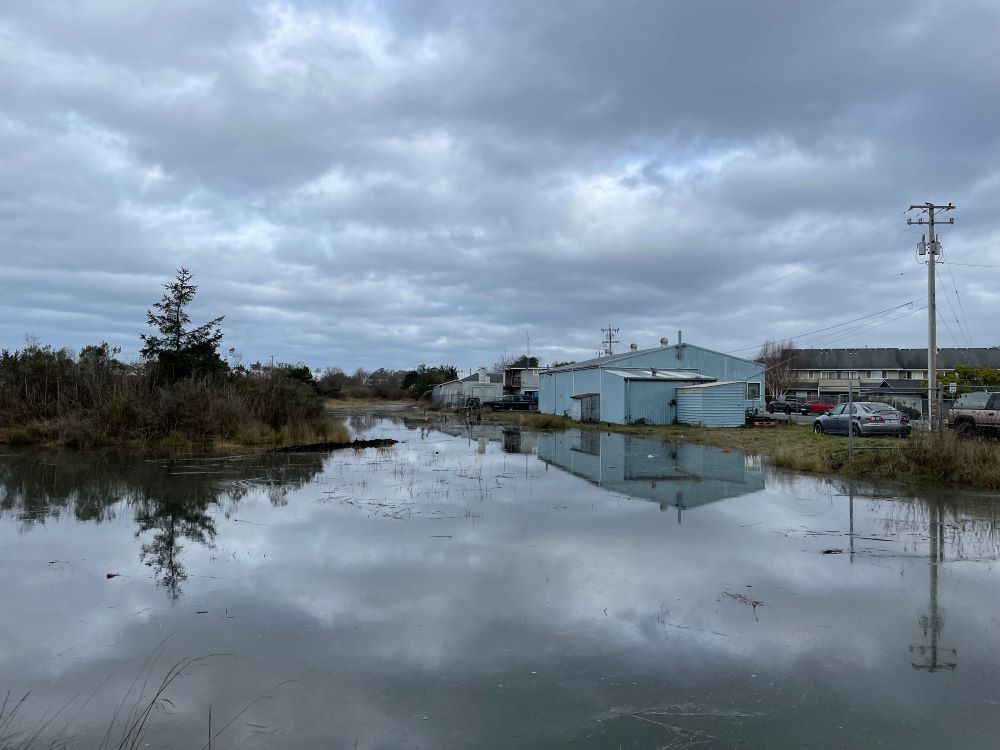
Perch Street, King Salmon, 12/6/2025
Crab Street, King Salmon, 12/4/2025
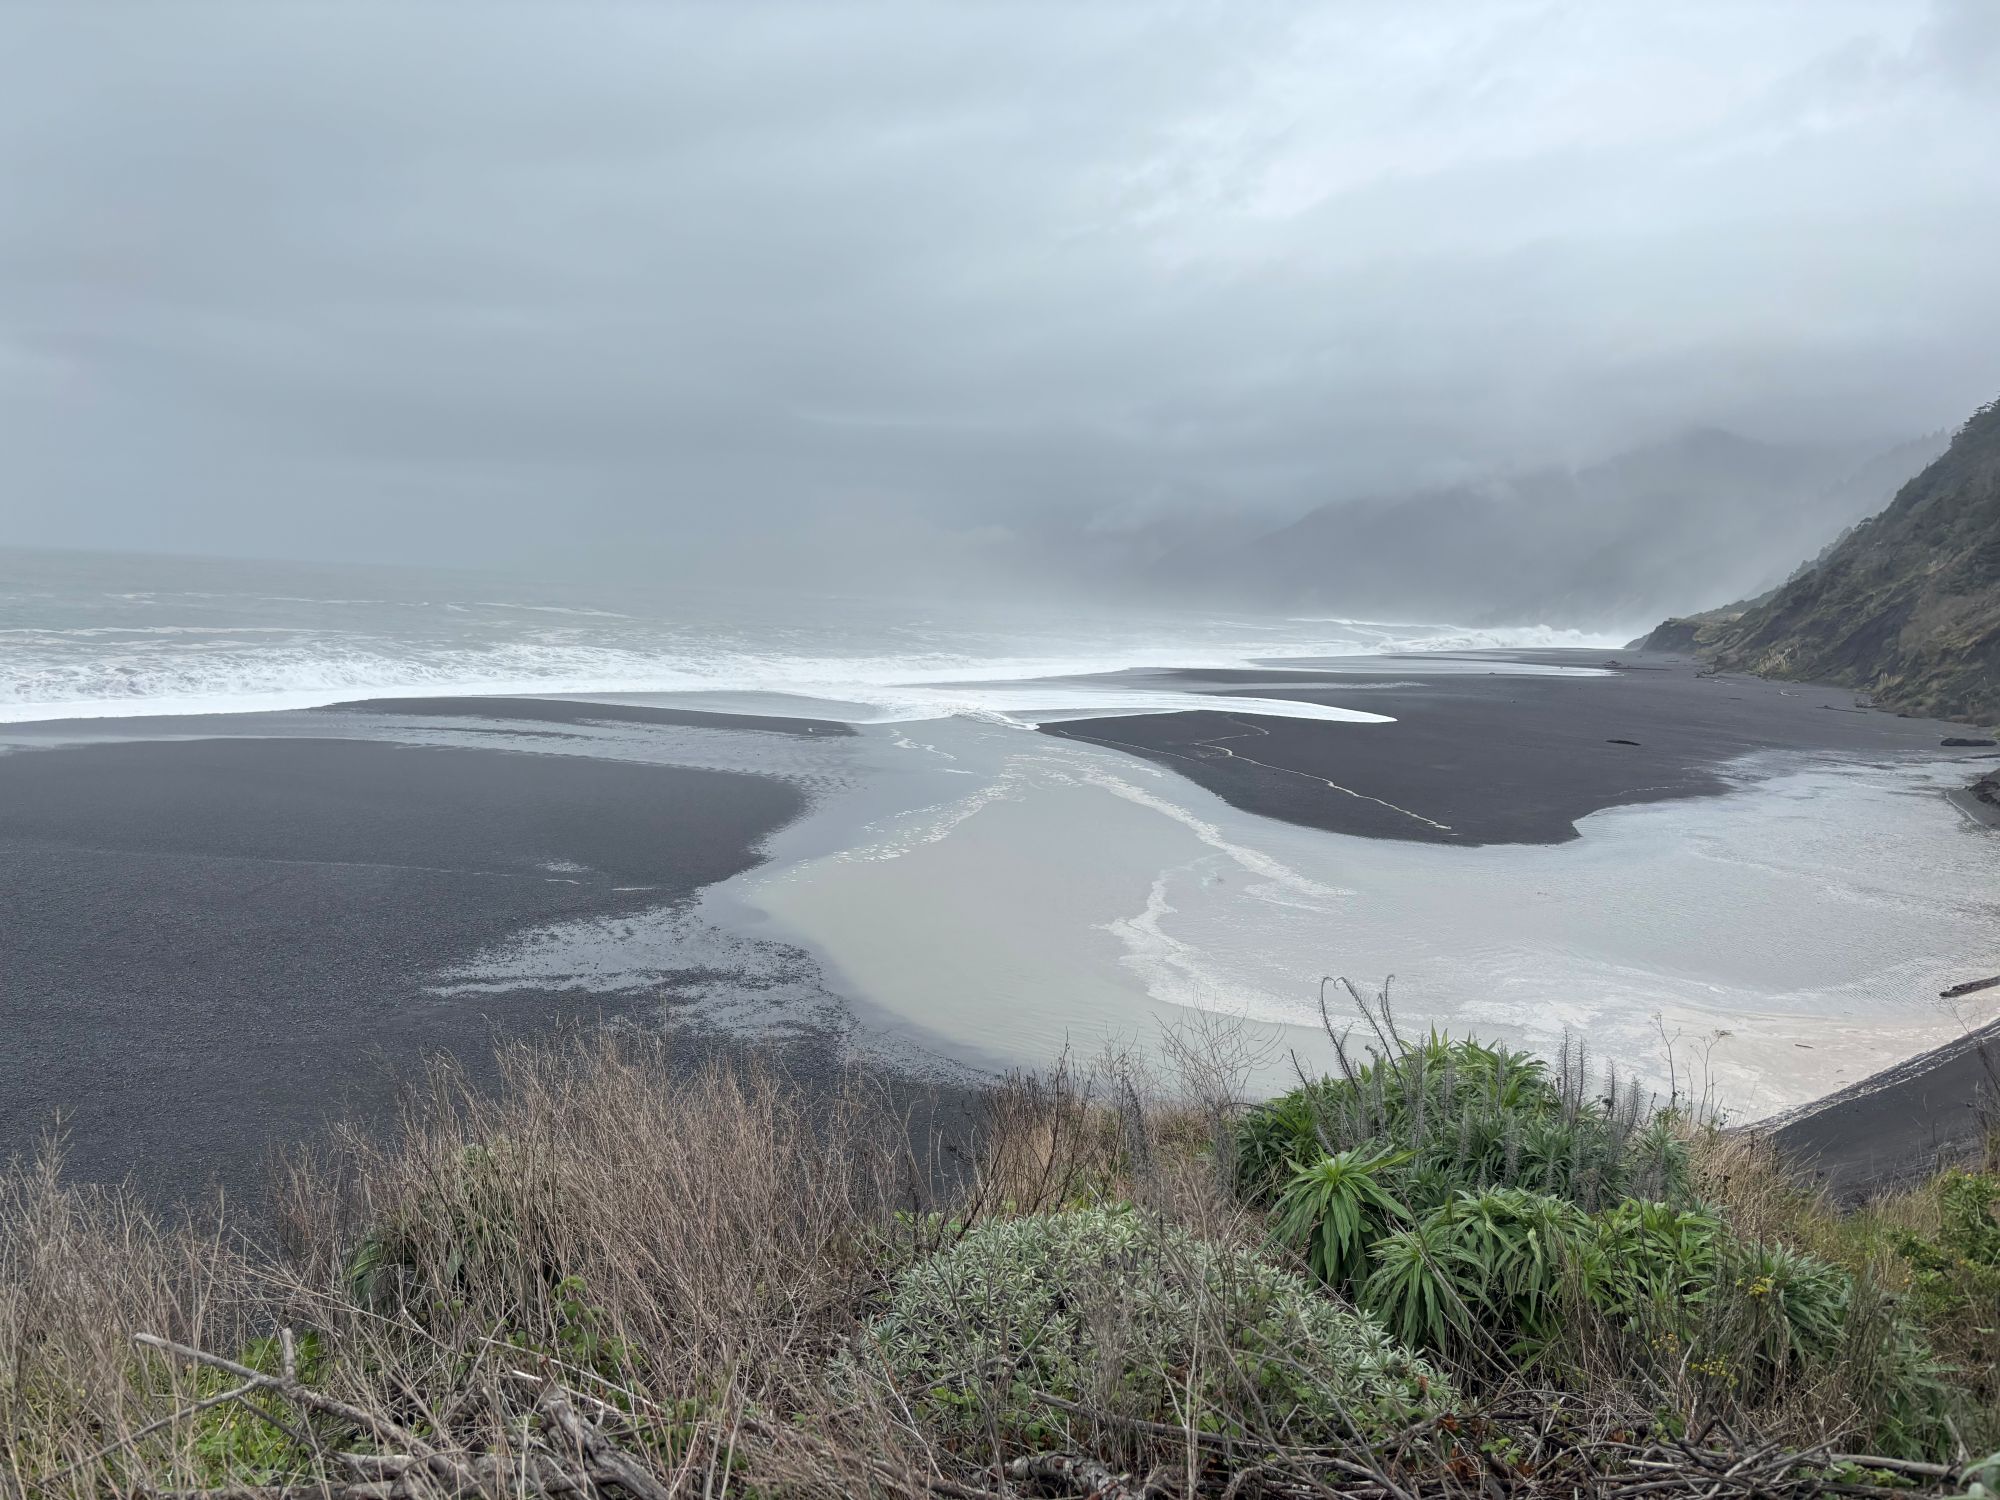
Telegraph Creek at Black Sands Beach, Shelter Cove, 11/6/2025
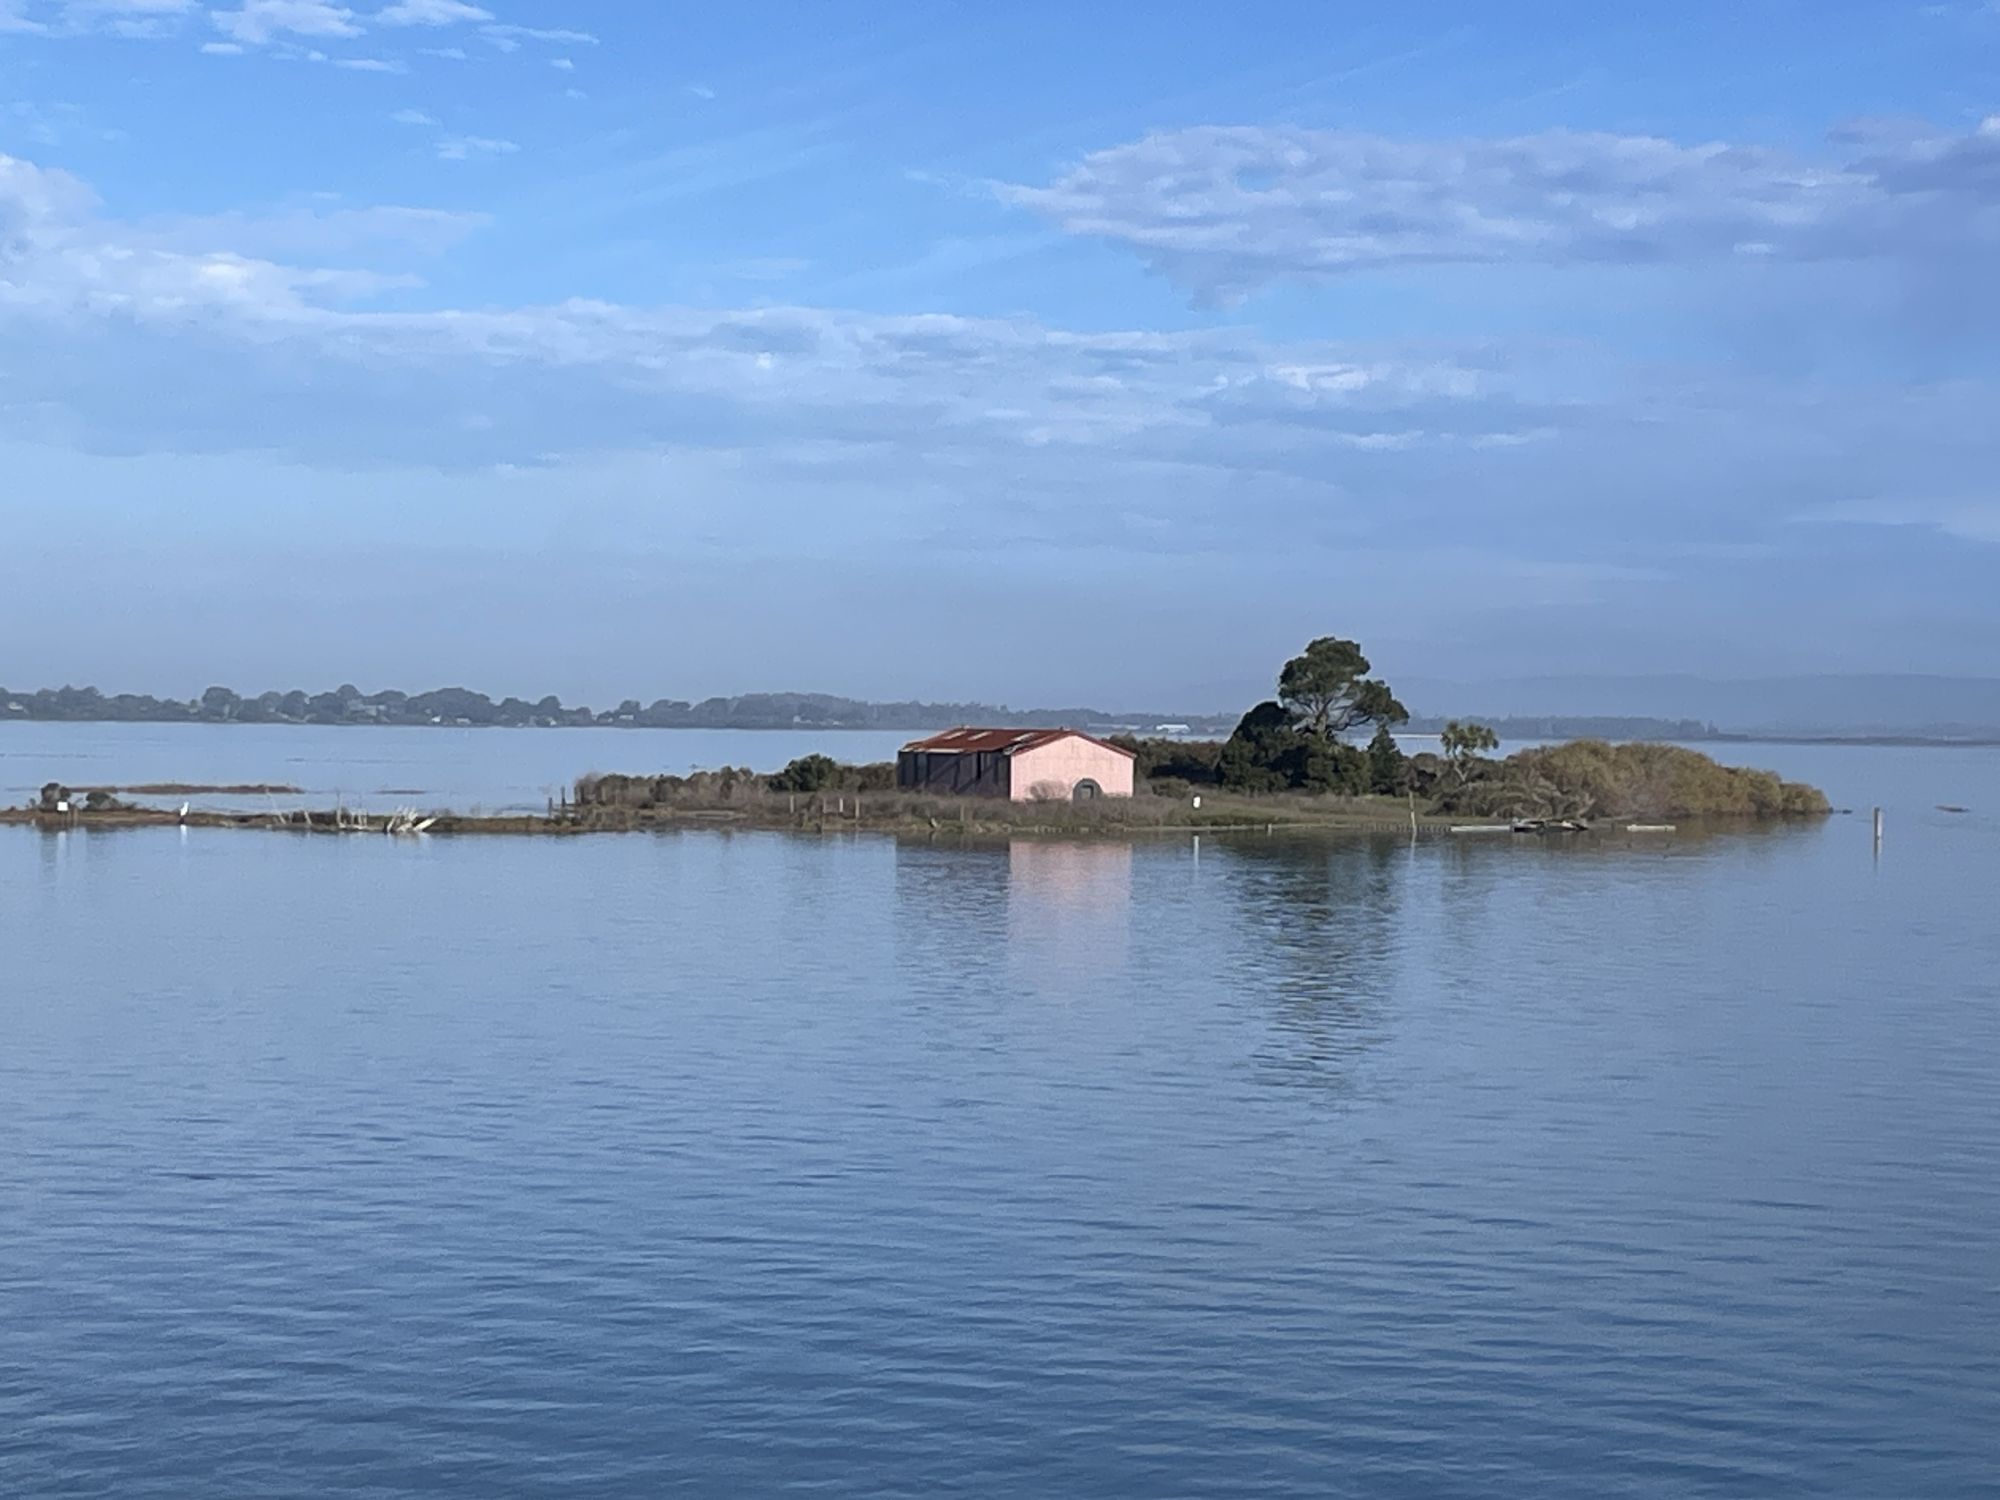
Tuluwat Island, Eureka, 12/4/2025
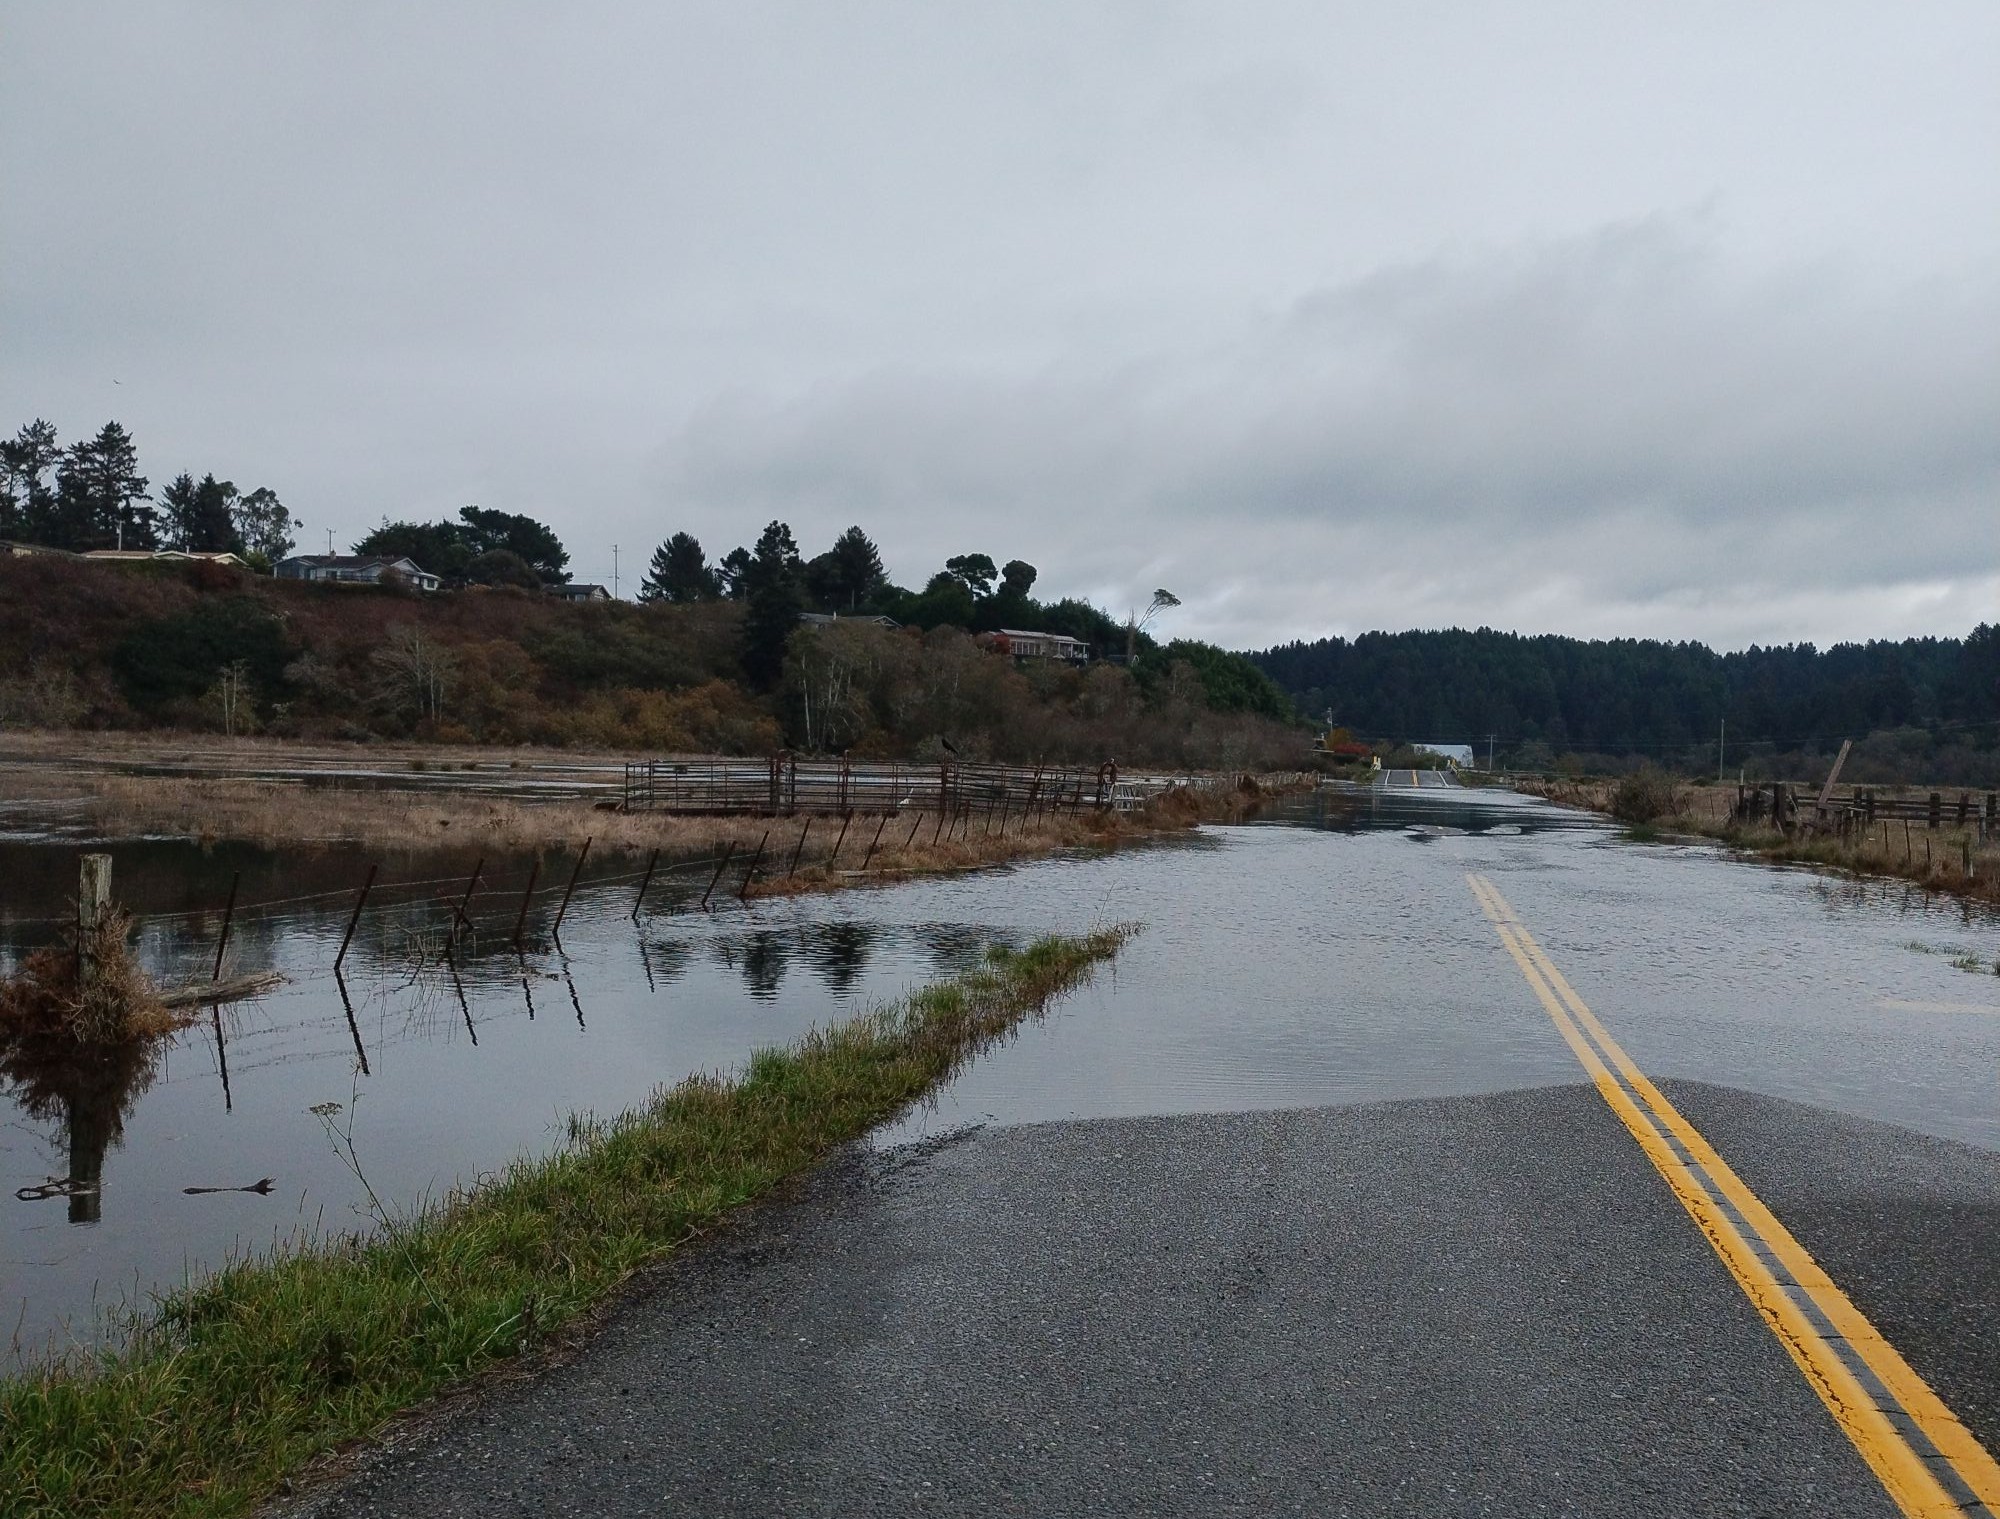
Pine Hill Road at Elk River Road, Eureka, 12/5/2025
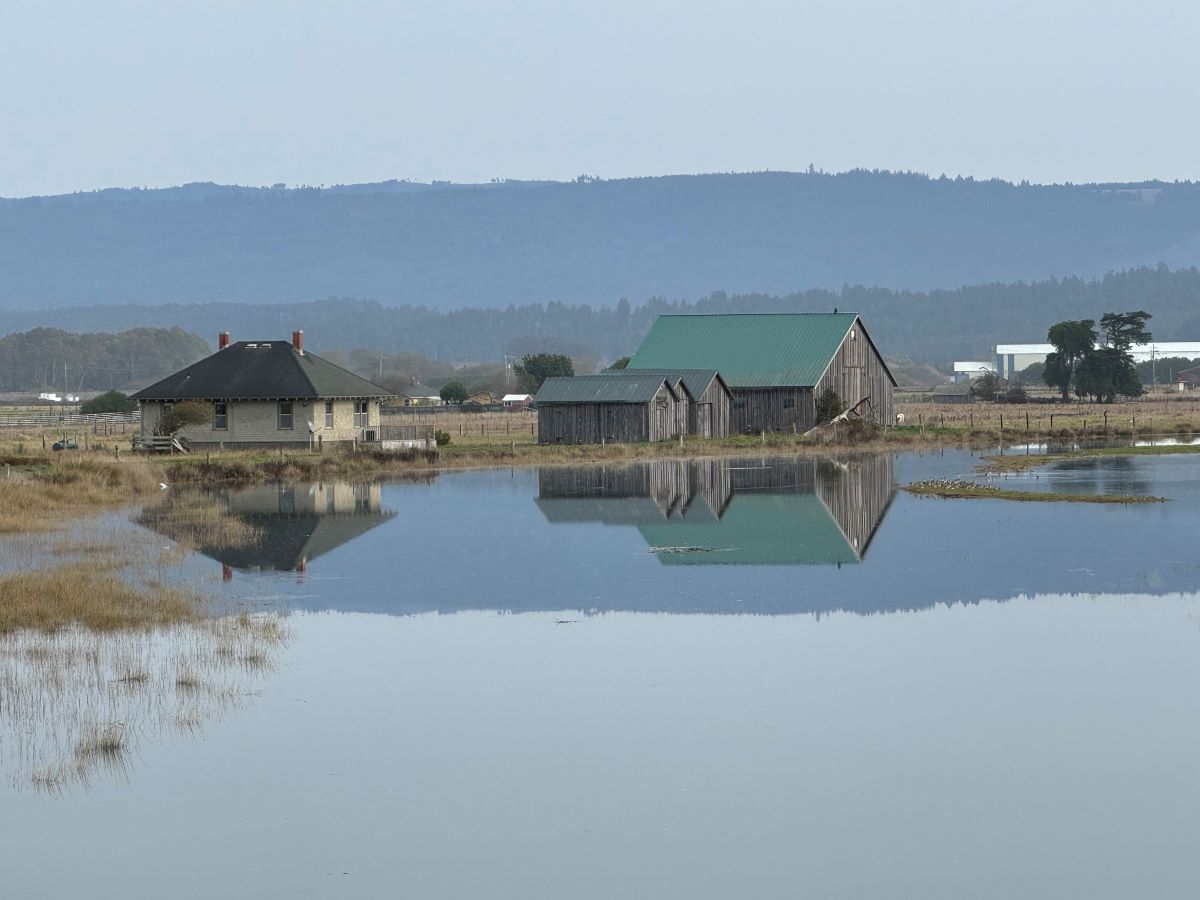
Liscom Slough, 11/16/2024

Martin Slough Bridge on Pine Hill Road, Eureka, 12/14/2024
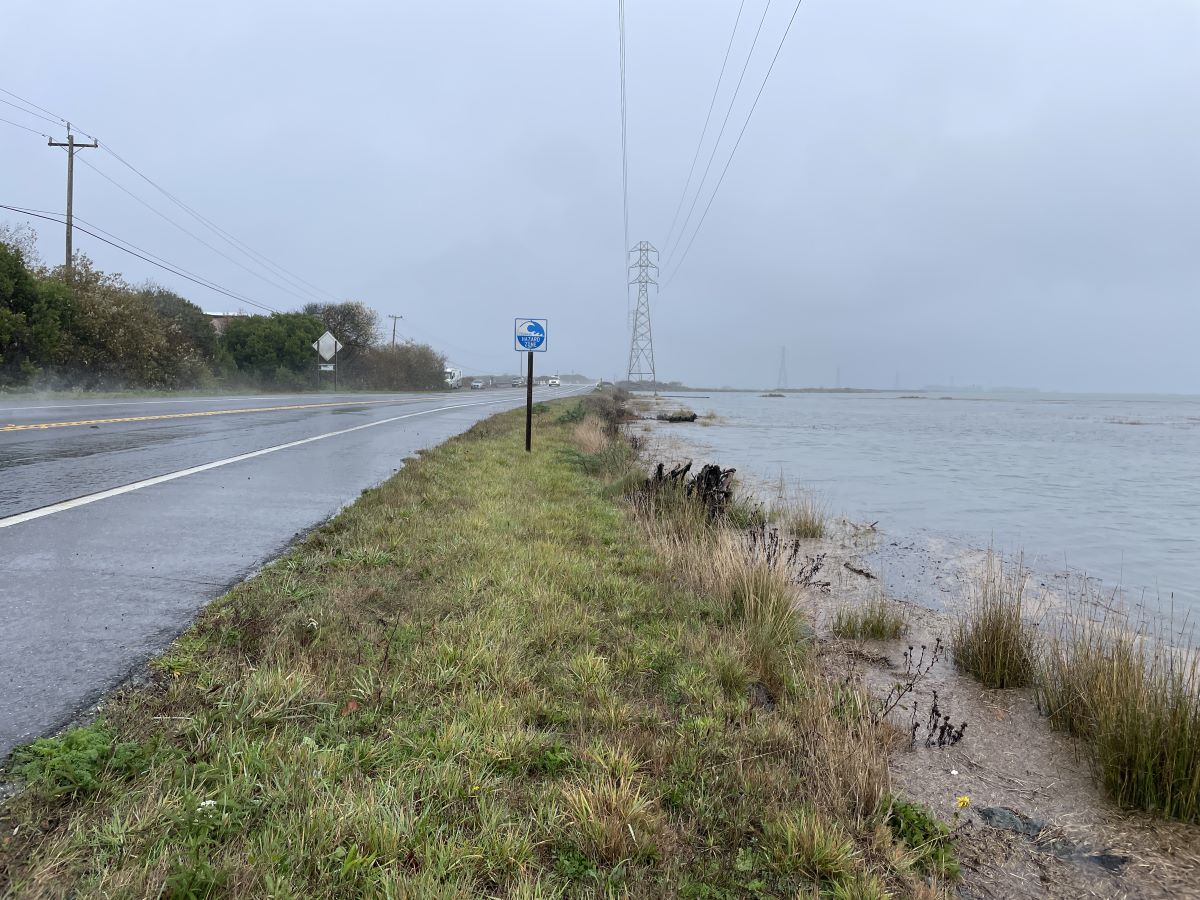
State Route 255, 11/17/2024
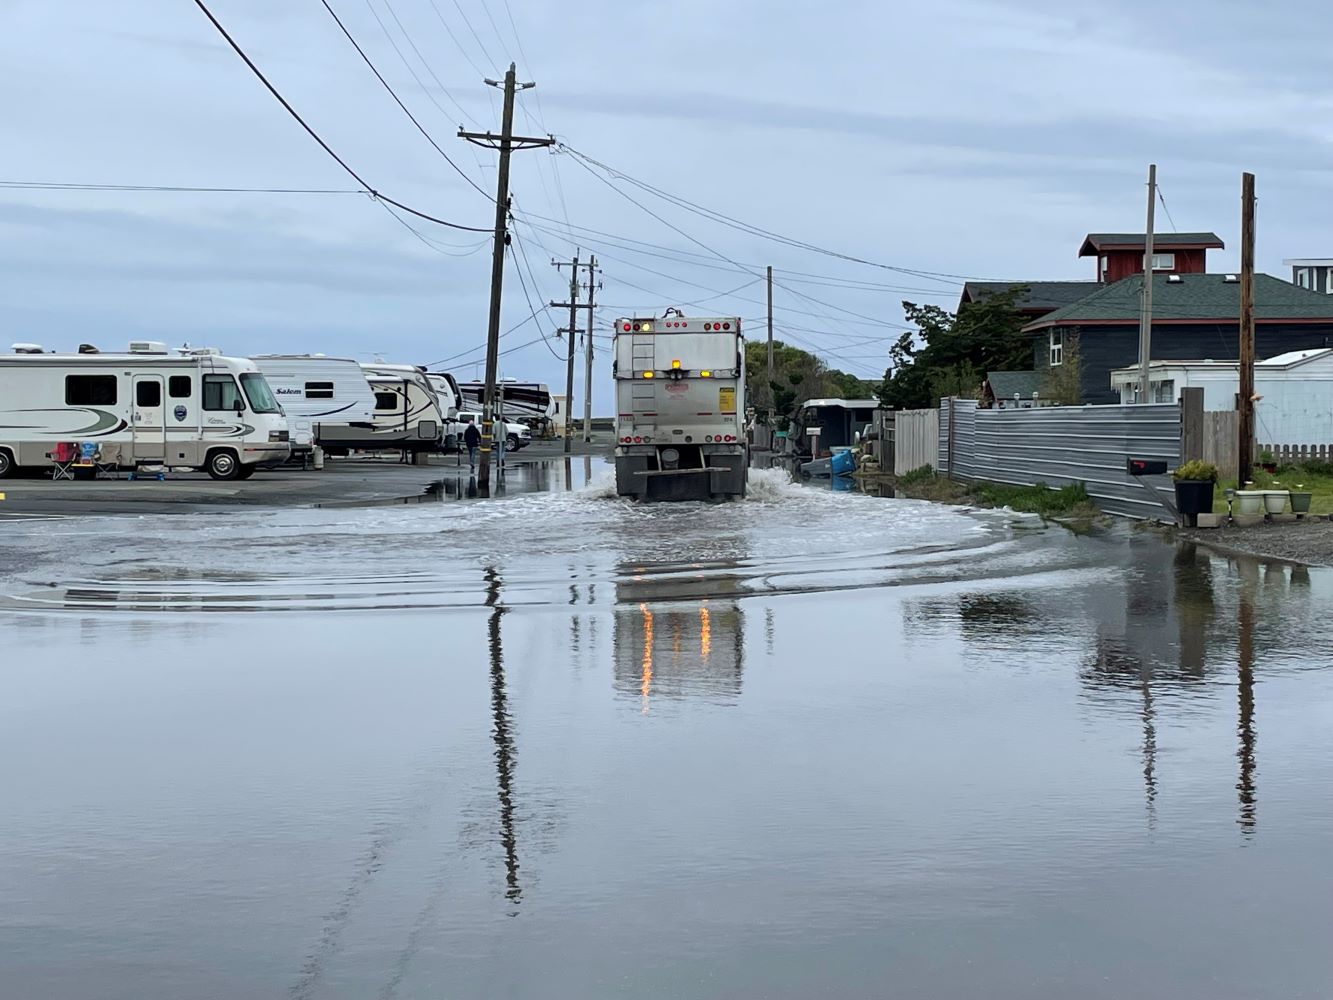
End of Perch Street, King Salmon, 1/12/2024
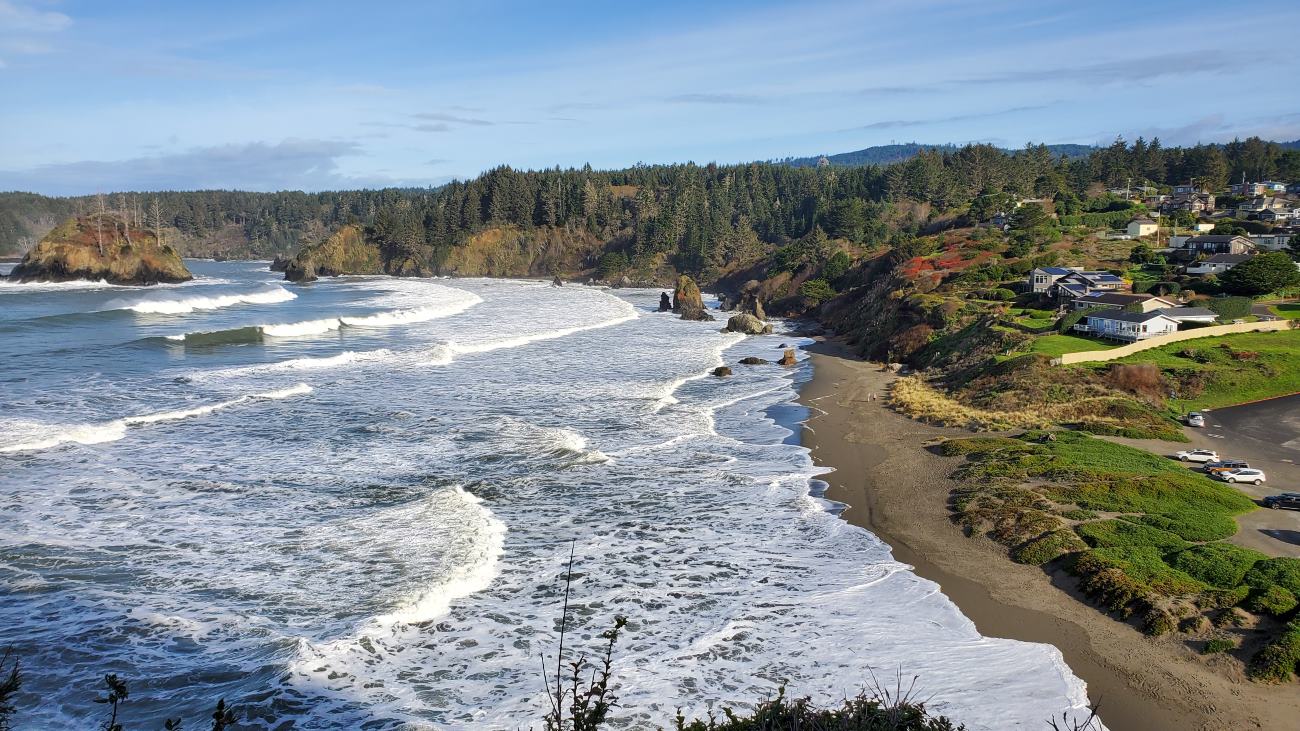
Trinidad State Beach, 1/11/2024
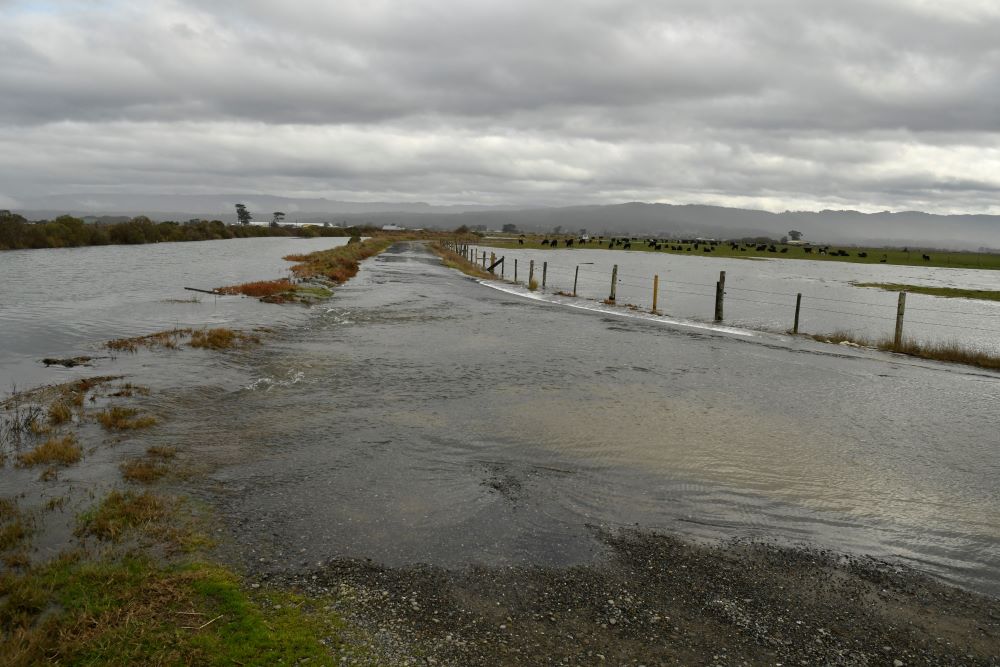
Jackson Ranch Road, Arcata, 12/23/22
Chevron Dock, Eureka, 1/22/2023
Butcher Slough at South H Street, Arcata, 12/23/22
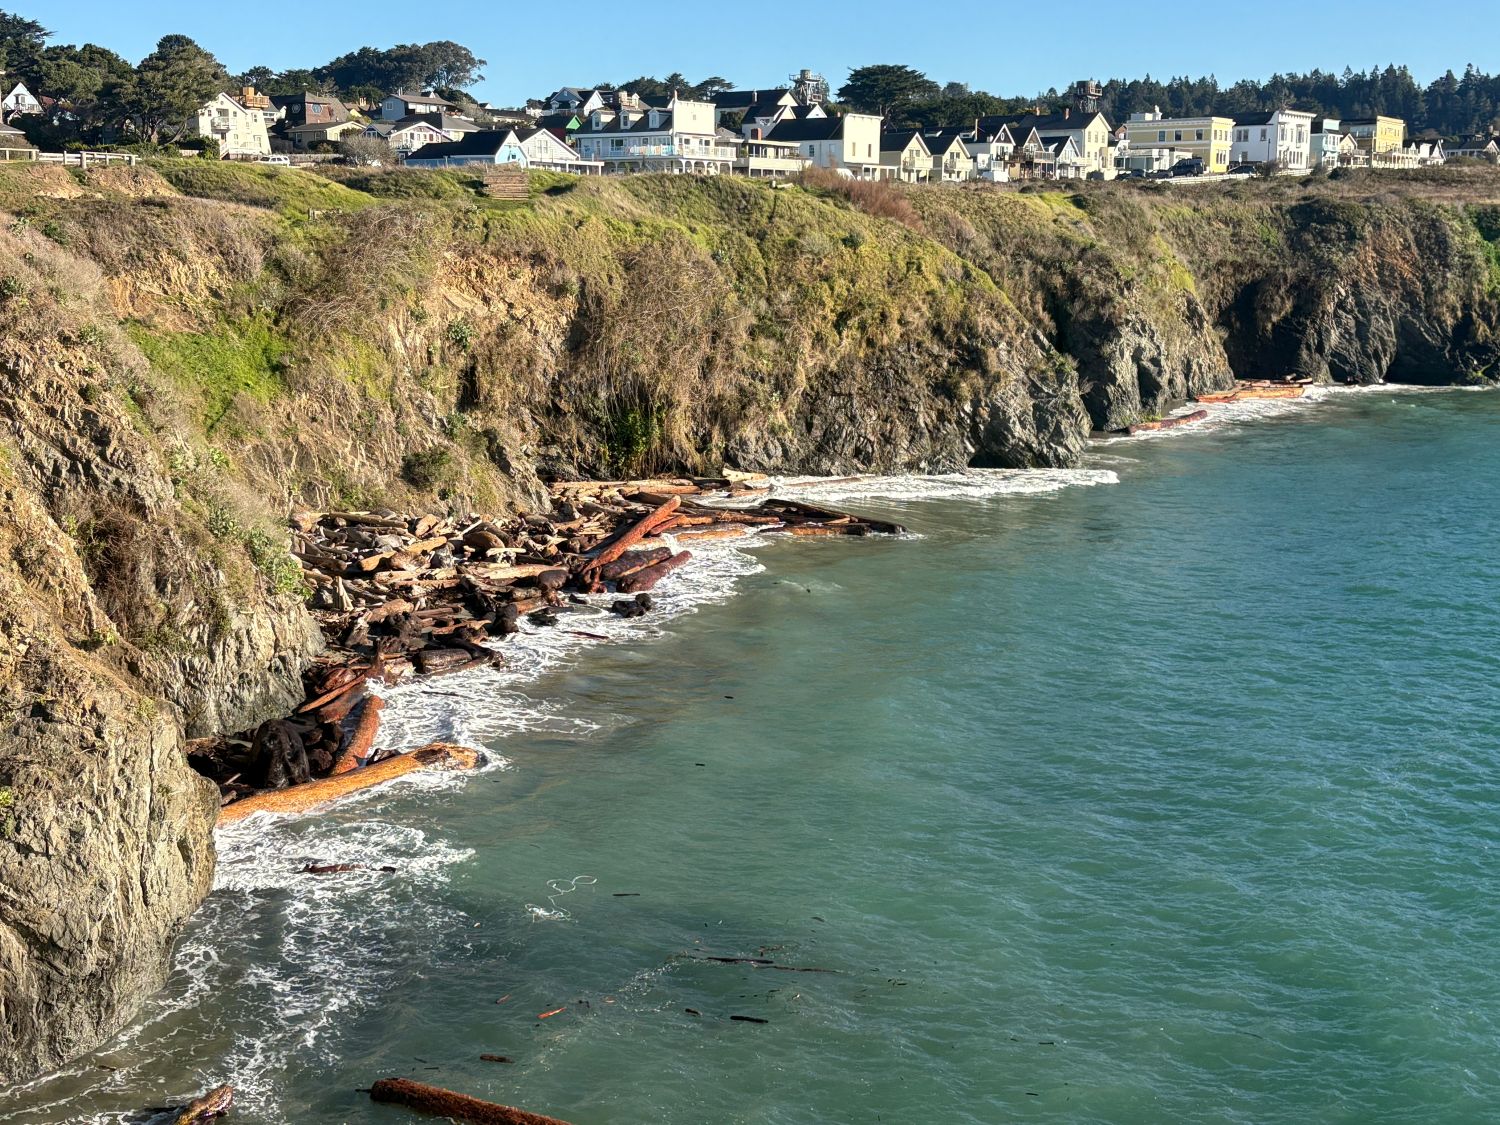
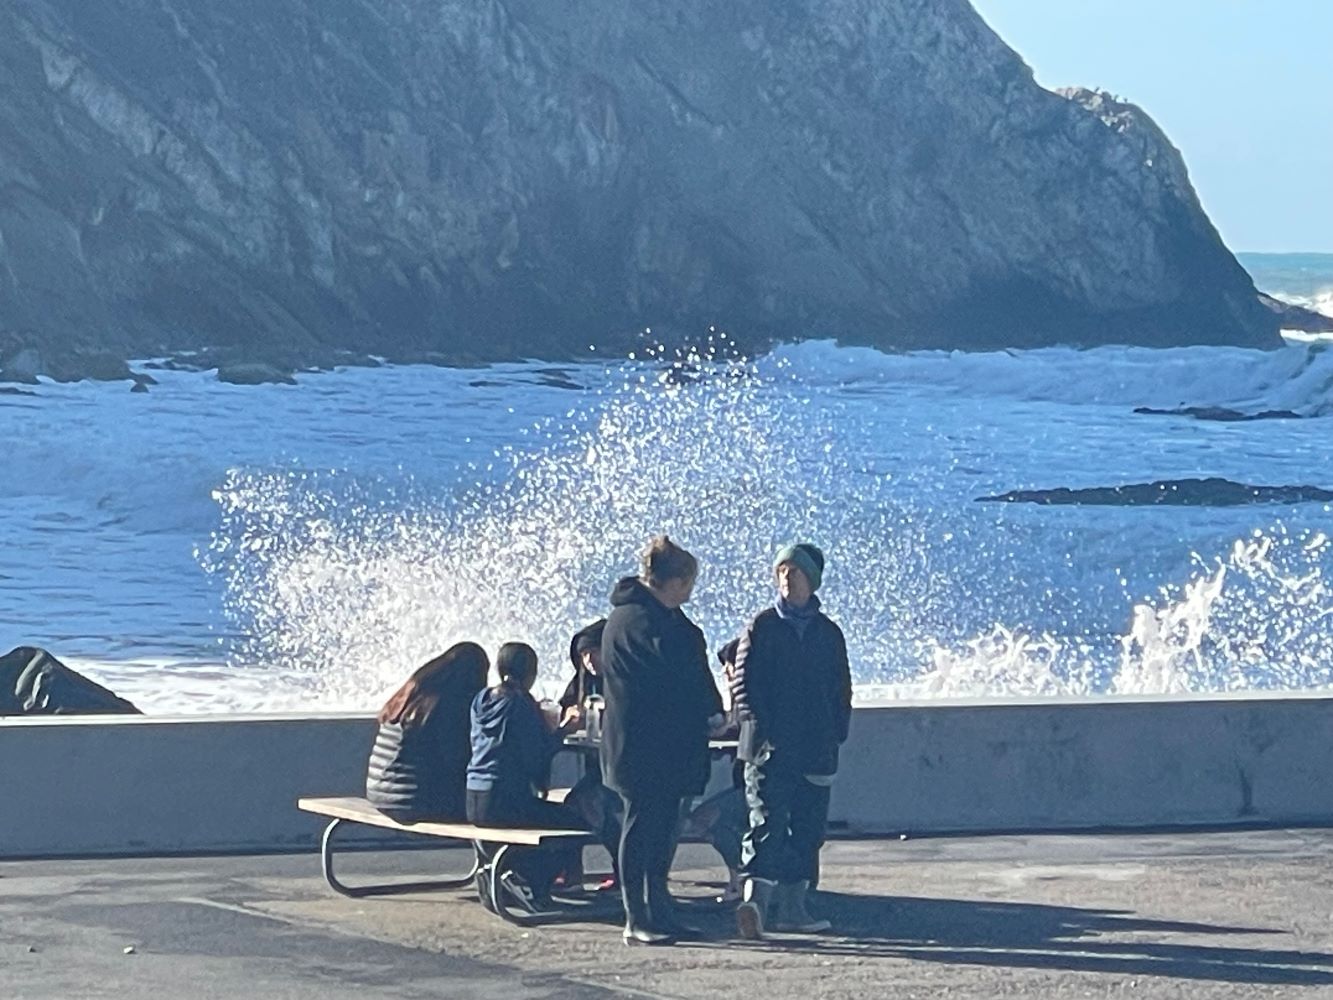
Portuguese Beach, Mendocino, 12/4/2025
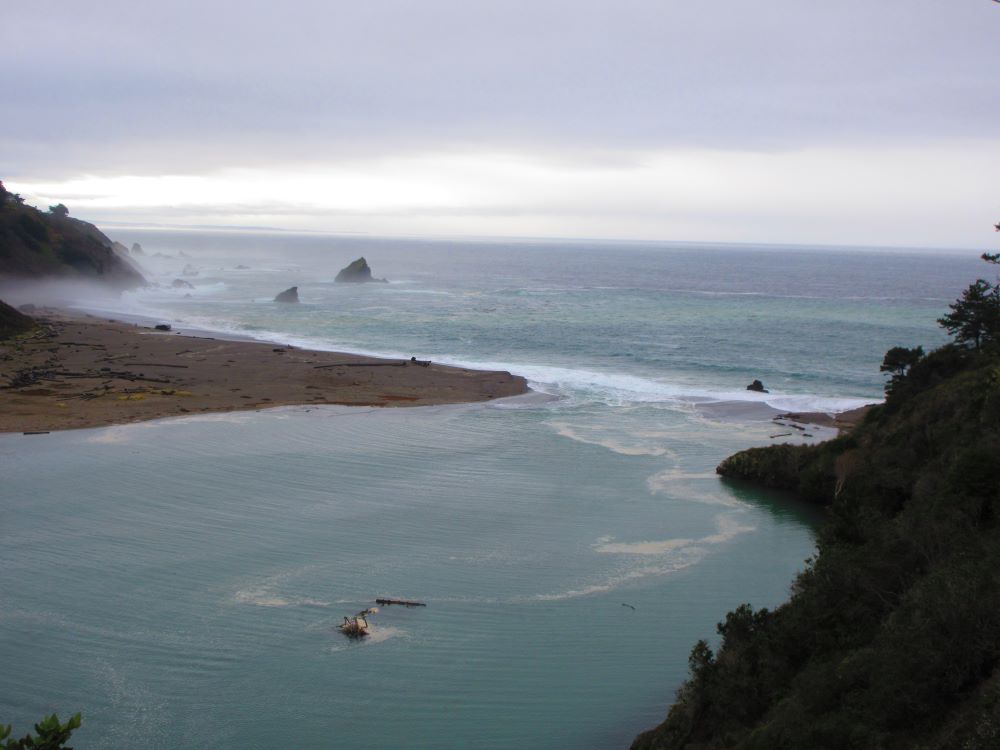
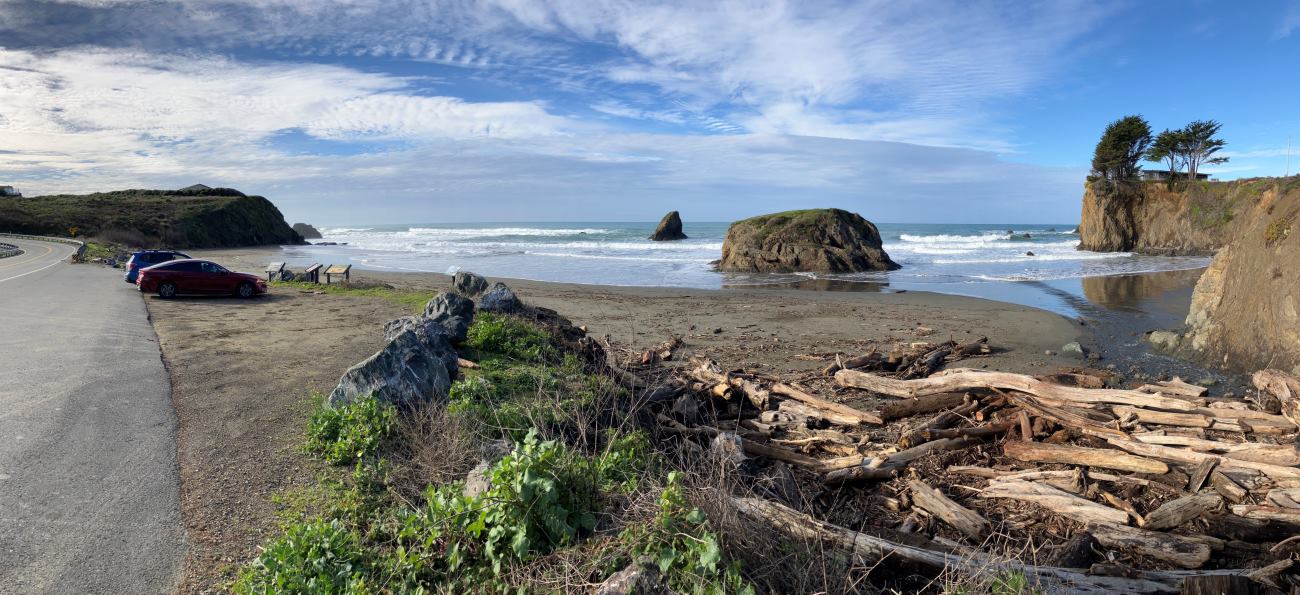
Navarro River, Albion, 11/15/2024
Cooks Beach, Gualala, 11/16/2024
Arena Cove, Point Arena, 1/11/2024
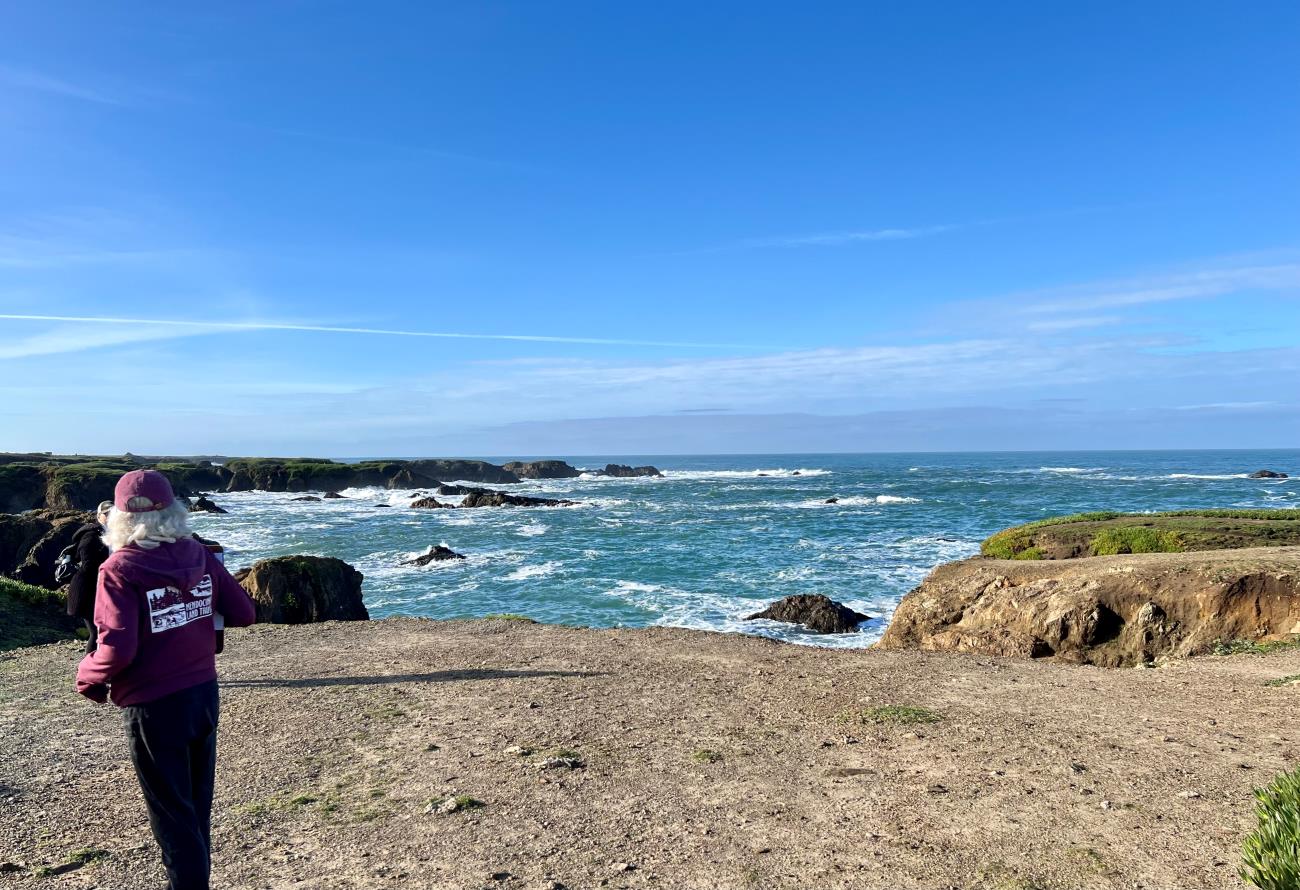
Glass Beach, Noyo Headlands, 2/9/2024
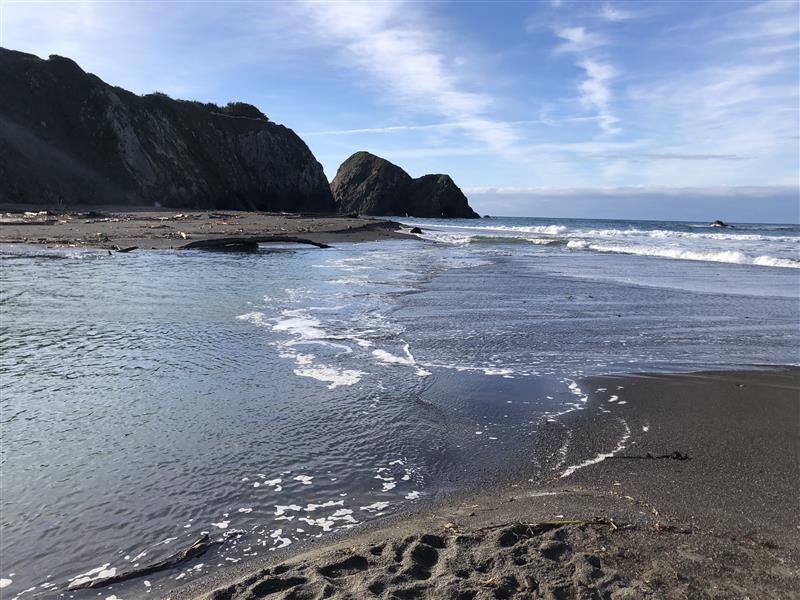
Seaside Beach, 1/12/2024
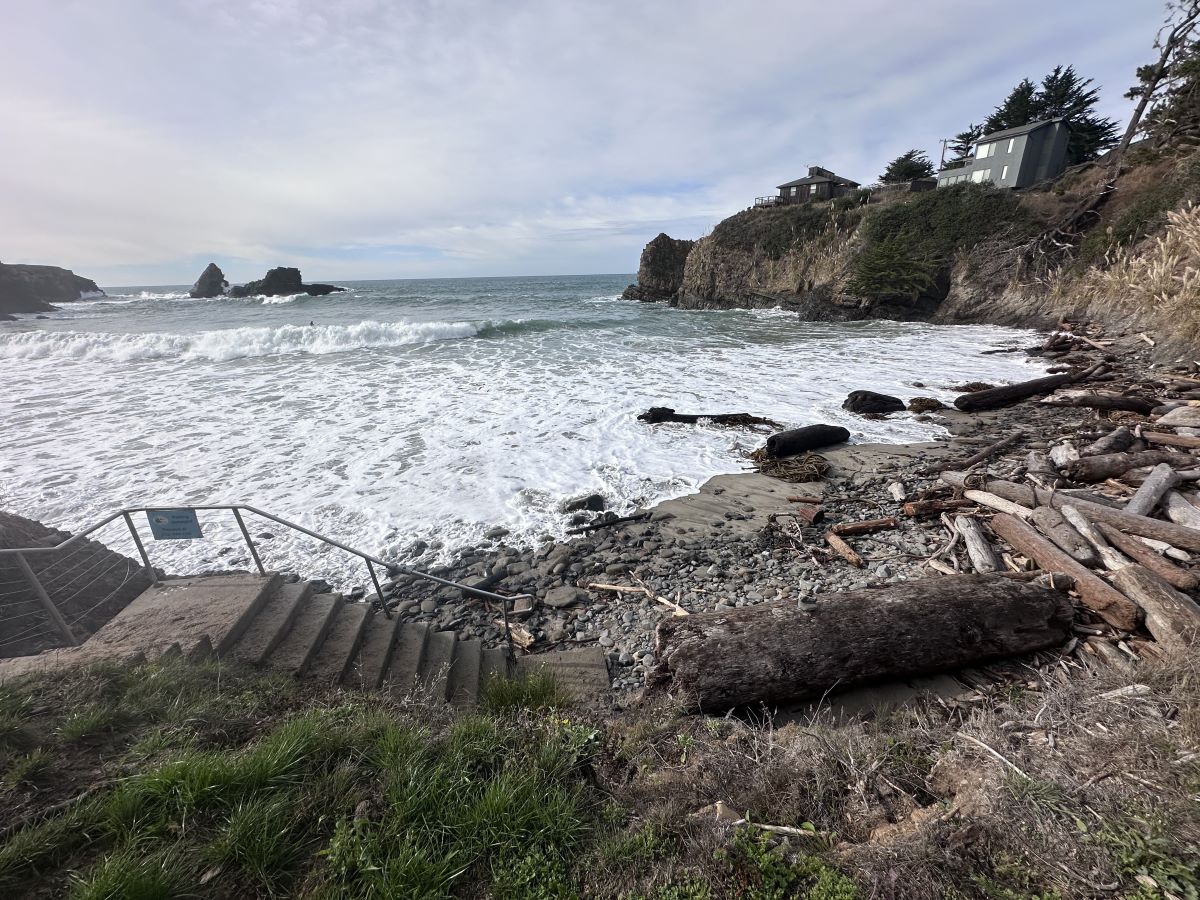
Greenwood State Beach, Elk, 1/2/2022
Mitchell Creek Beach, Fort Bragg, 1/2/2022
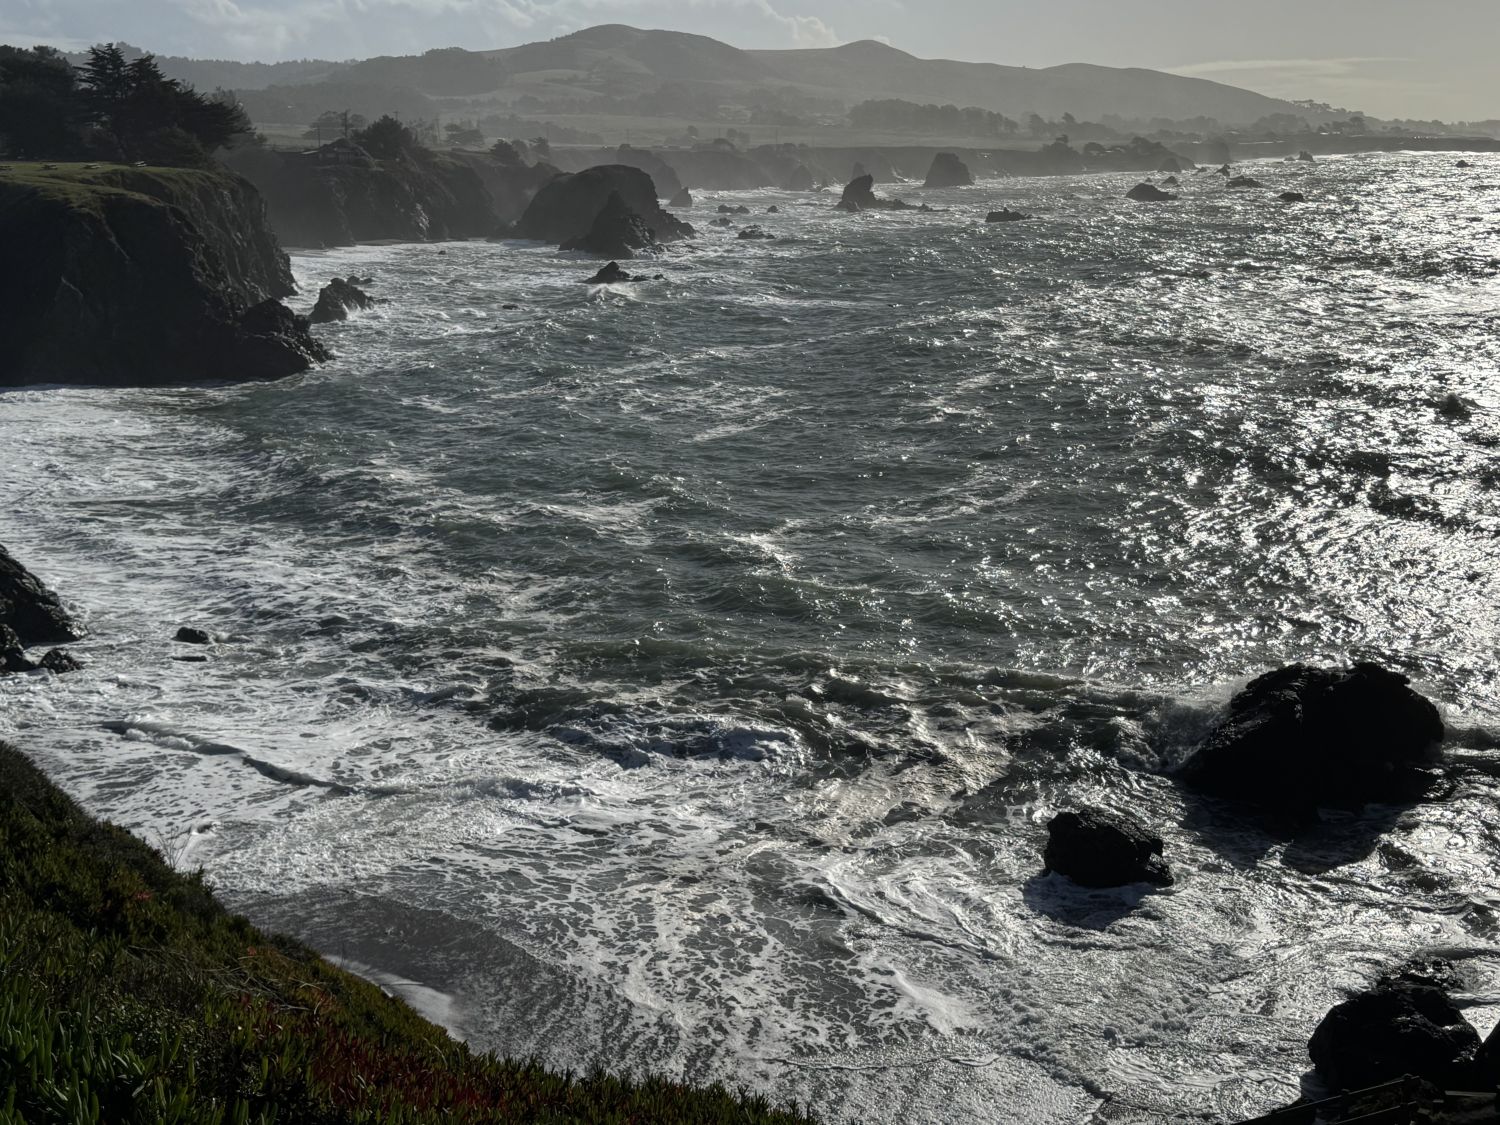
Duncan's Landing, Bodega Bay, 1/3/2026
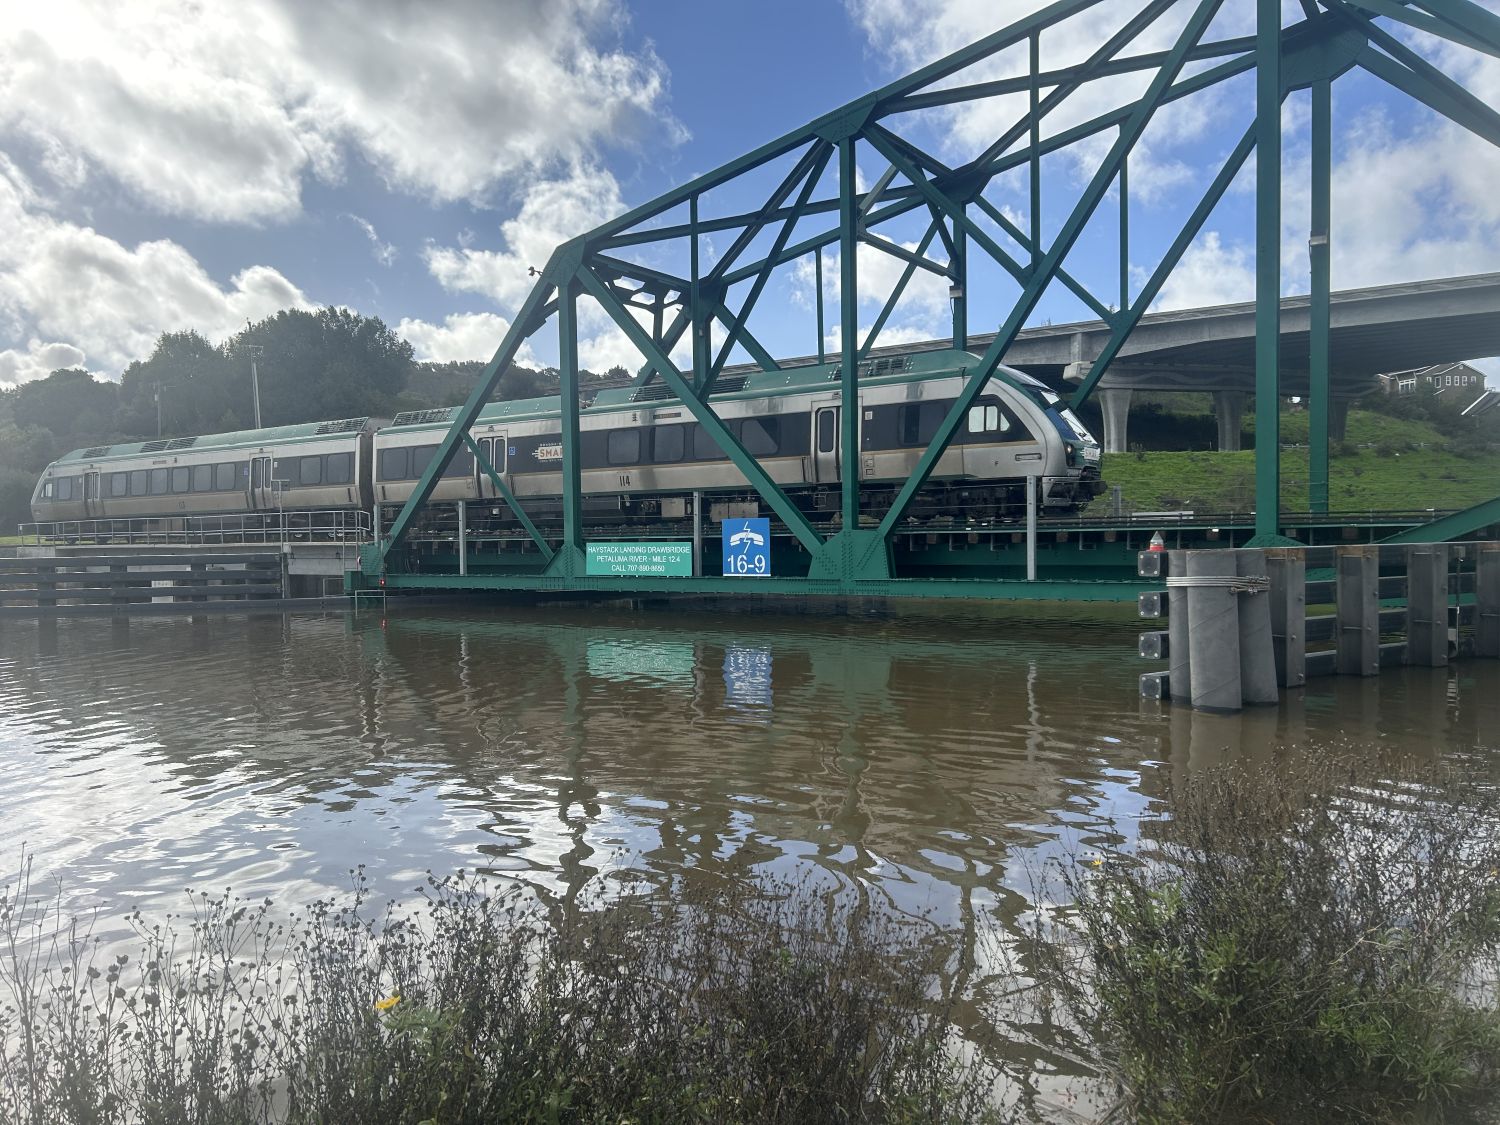
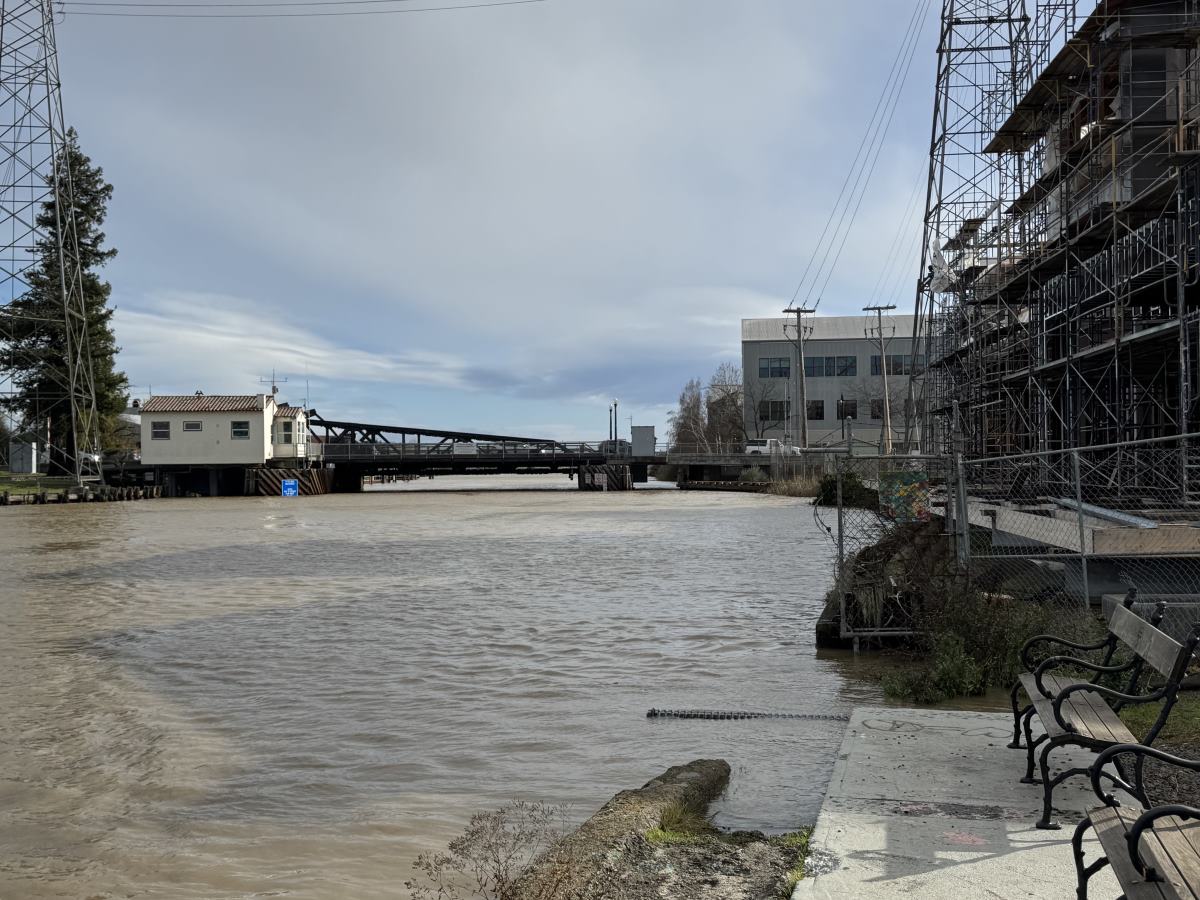
Haystack Landing Drawbridge, Petaluma, 1/3/2026
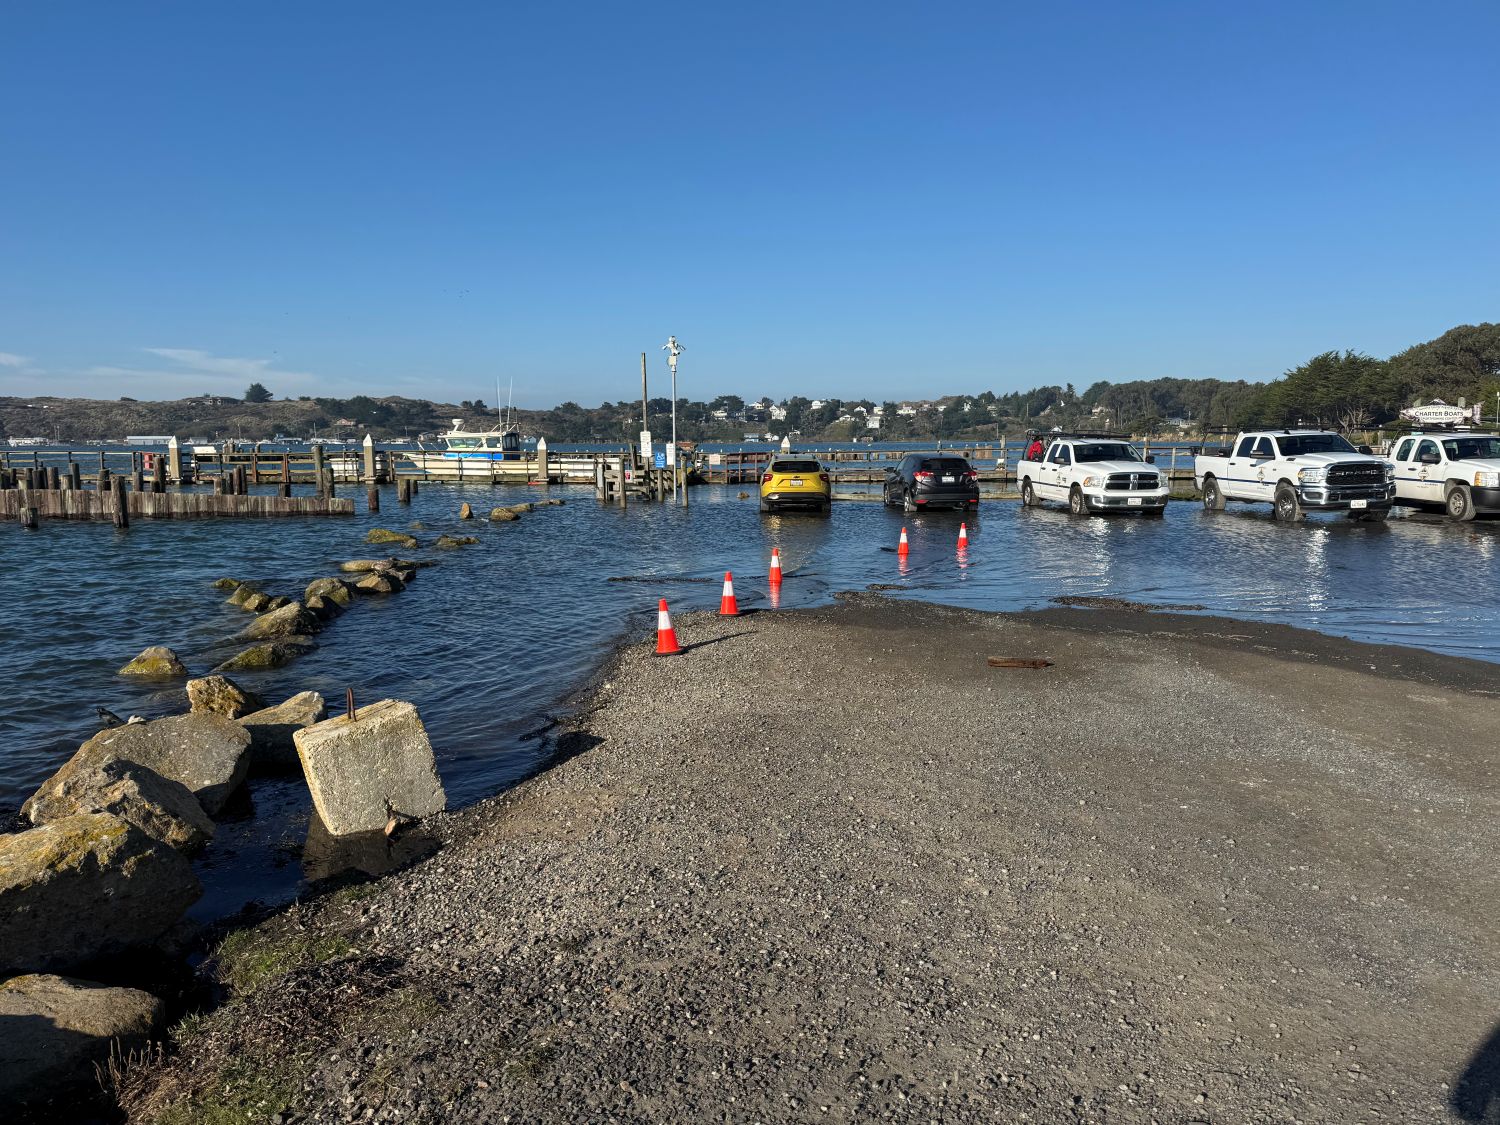
Porto Bodega, Bodega Bay, 12/5/2025
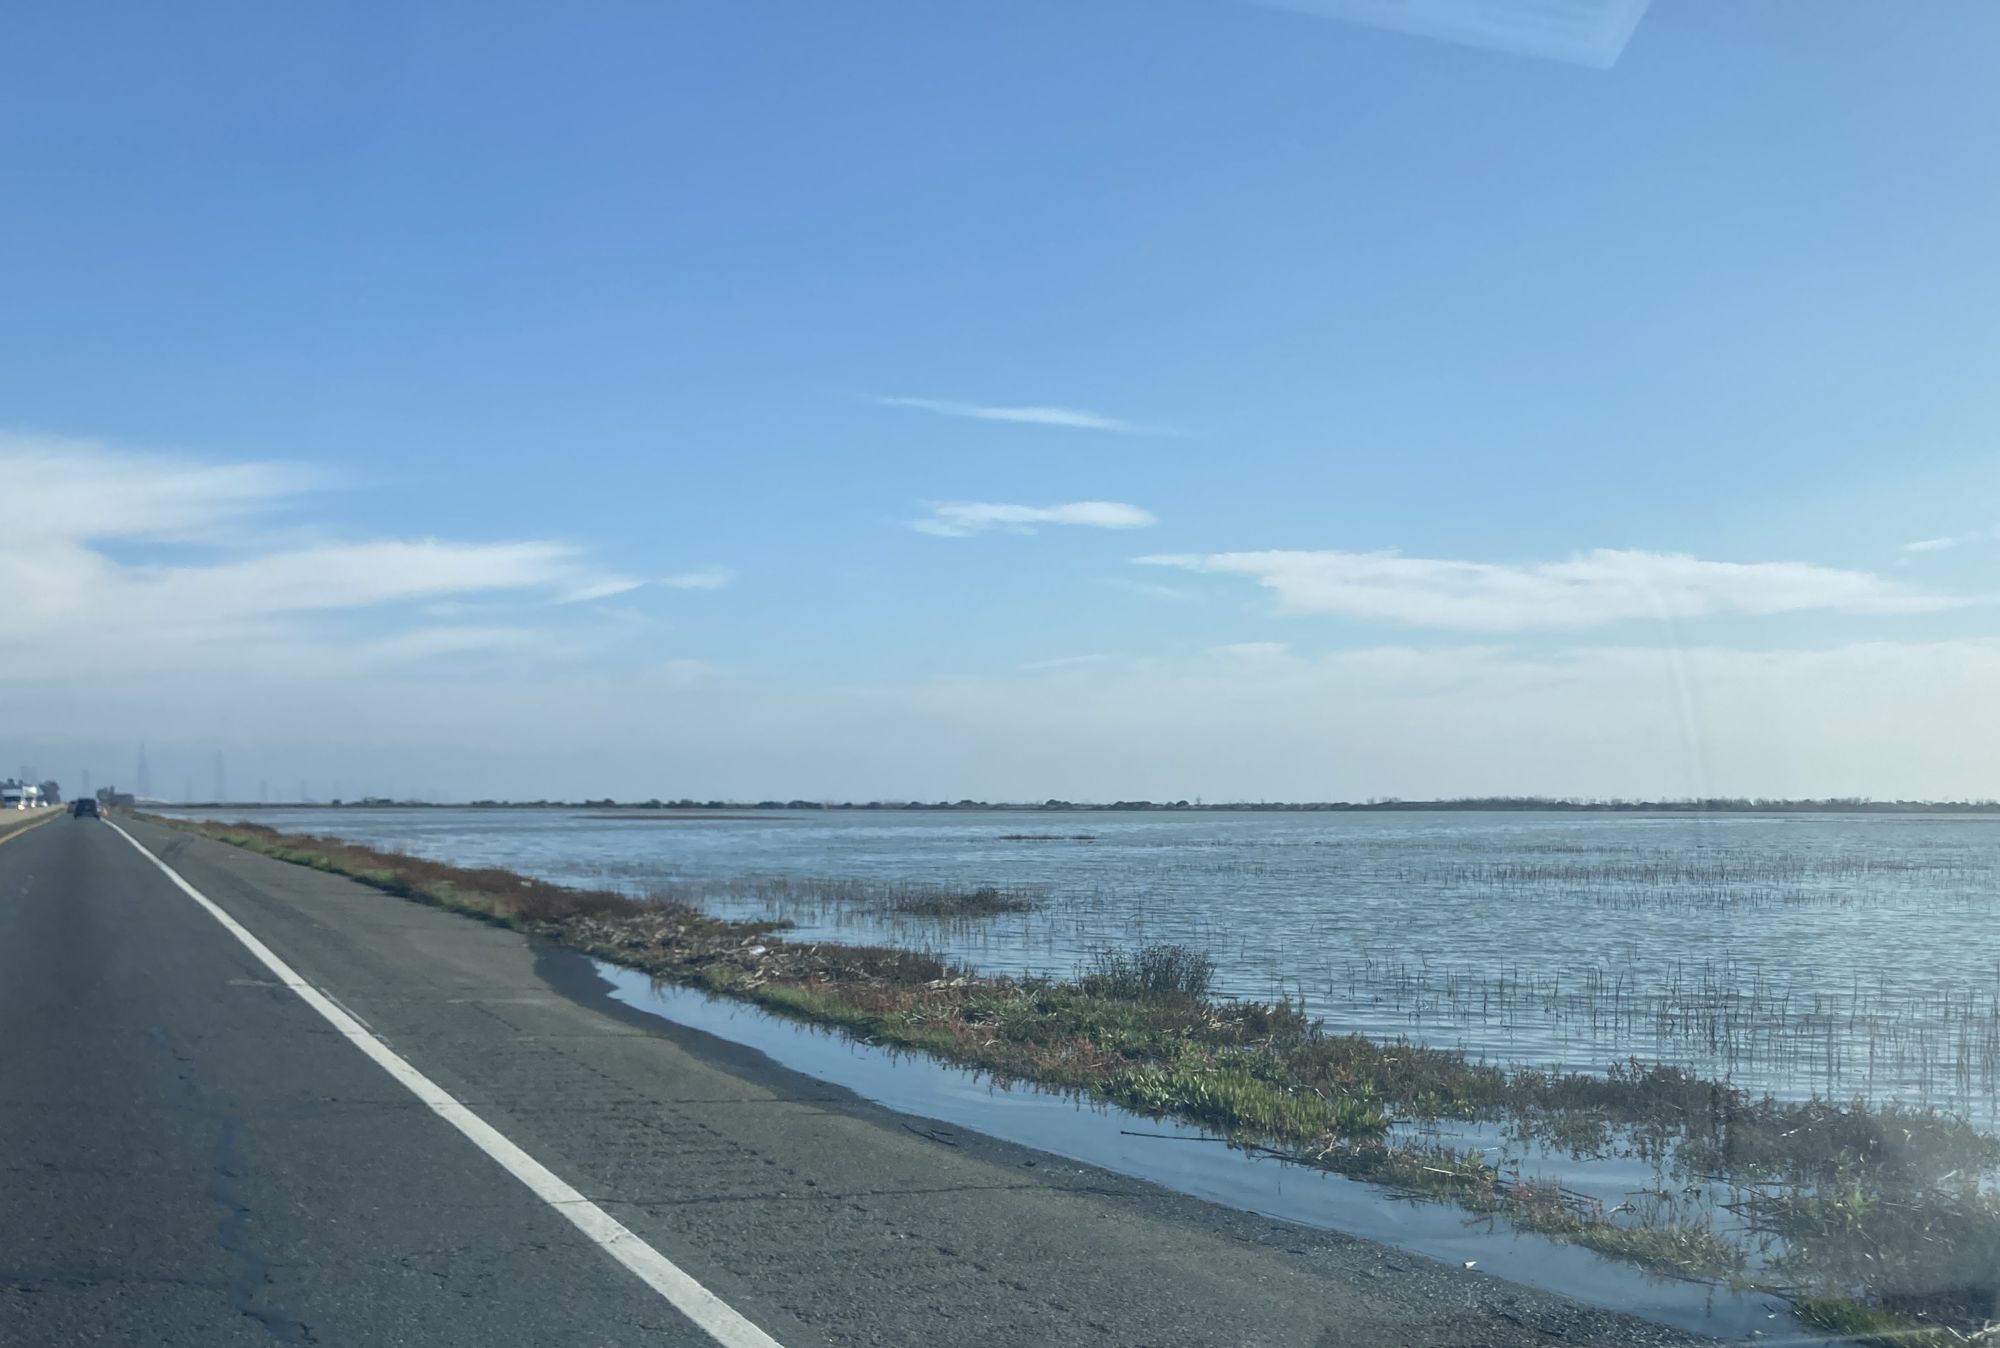
Sears Point Road, Sonoma, 12/4/2025
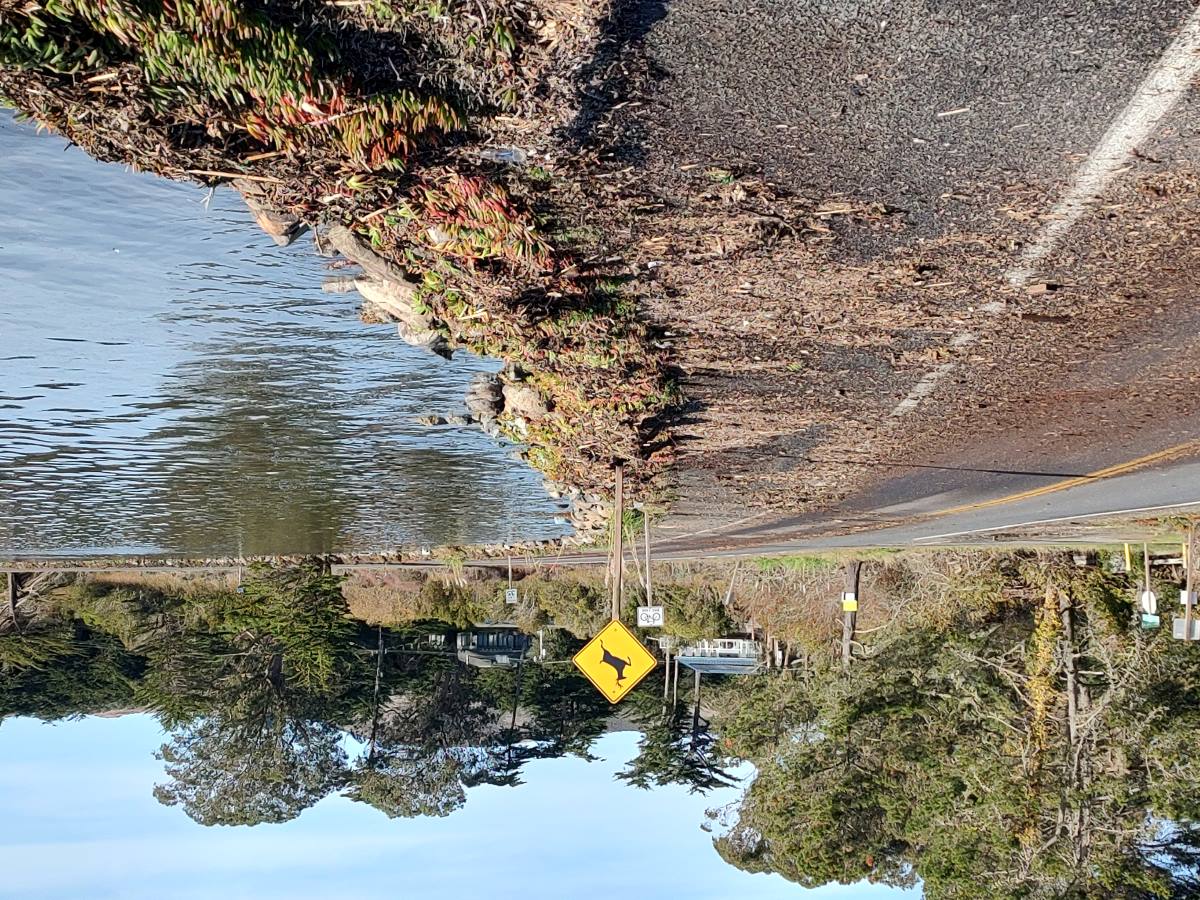
Westshore Road, Bodega Bay, 12/15/2024
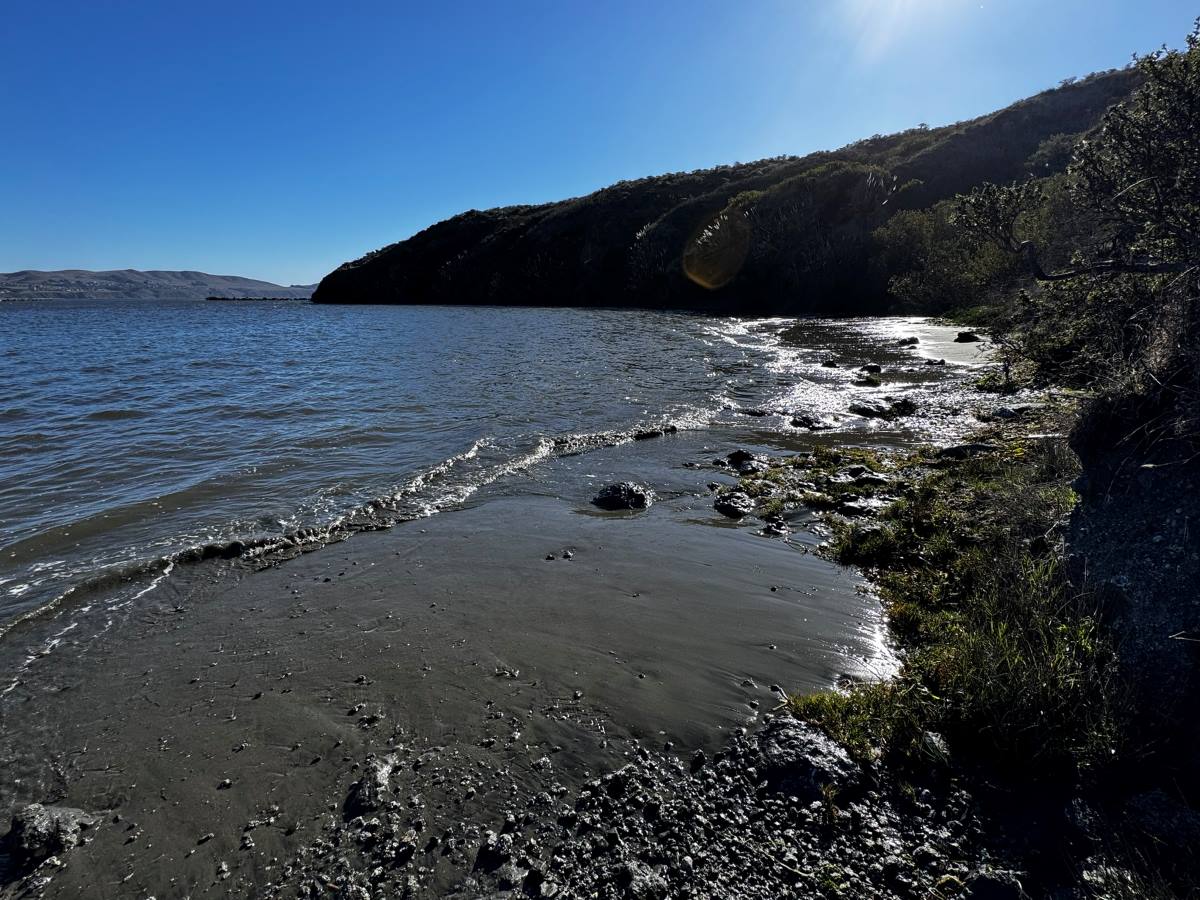
Bodega Bay, 11/15/2024
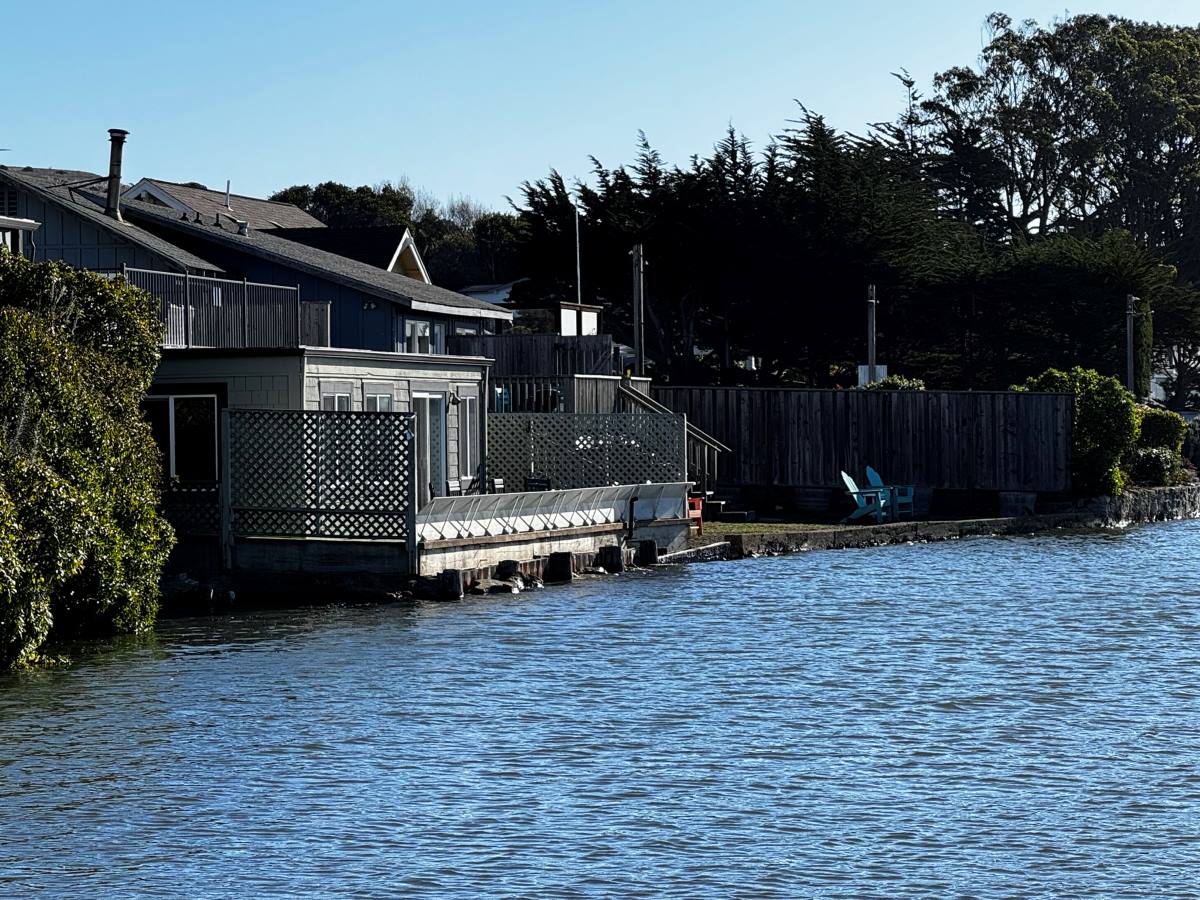
Campbell Cove, Bodega Bay, 11/15/2024
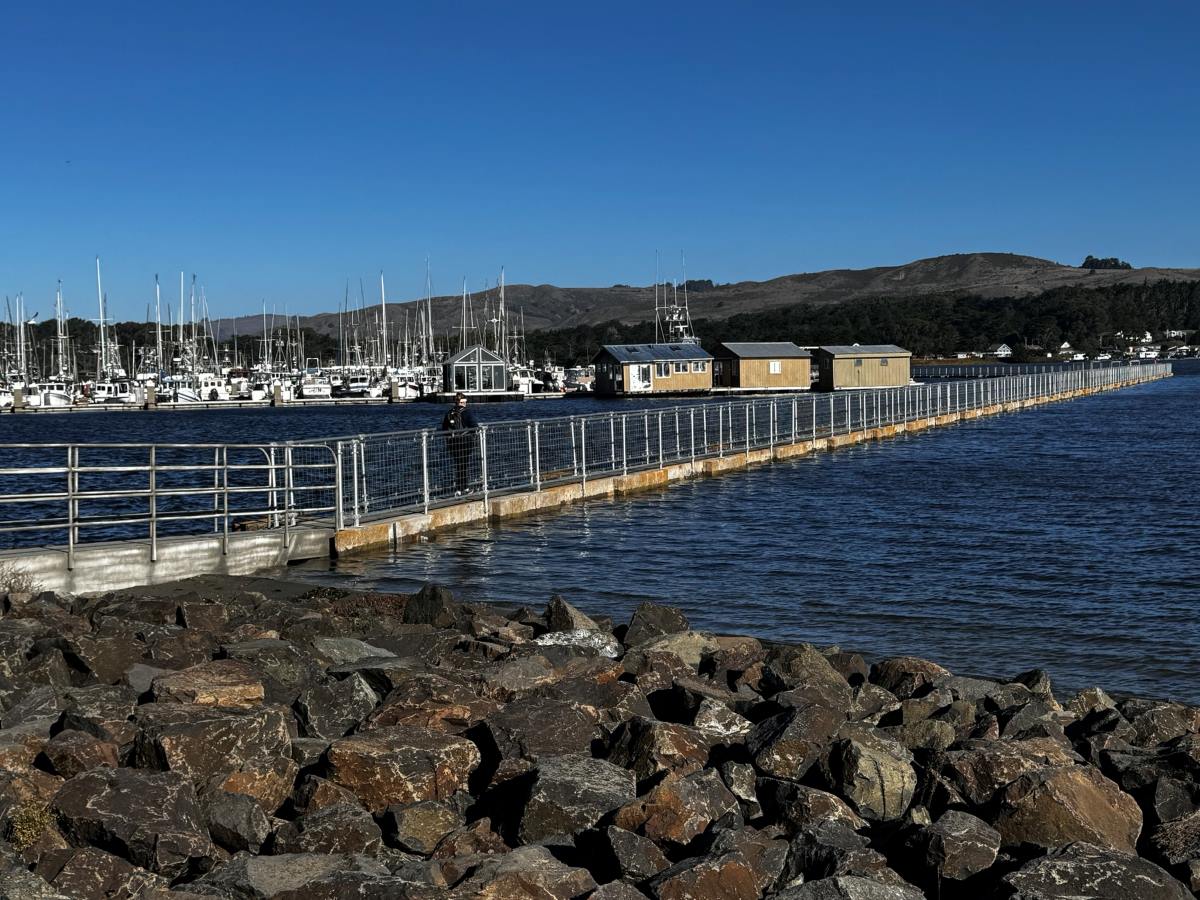
Spud Point Marina, Bodega Bay, 11/15/2024
Petaluma Turning Basin, 12/14/2024
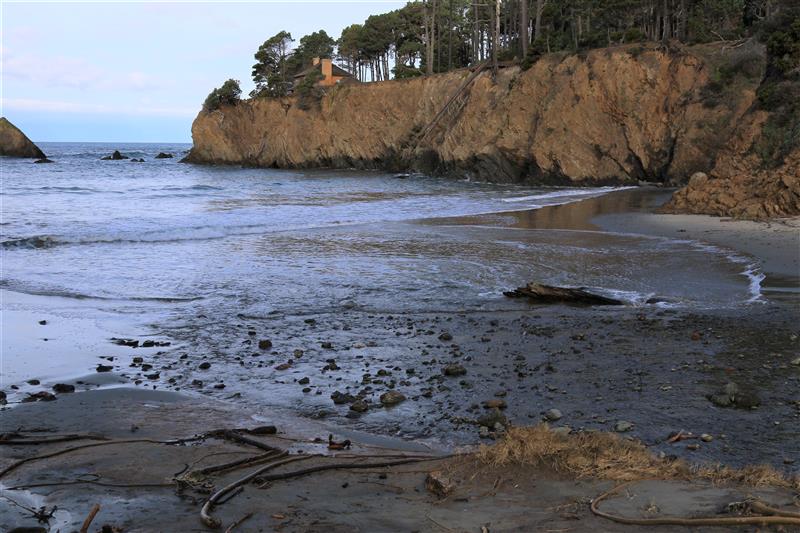
Duncan's Landing, Sonoma Coast, 2/9/2024
Black Point Beach, Sea Ranch, 12/23/2022
Port Sonoma Marina, 12/23/2022
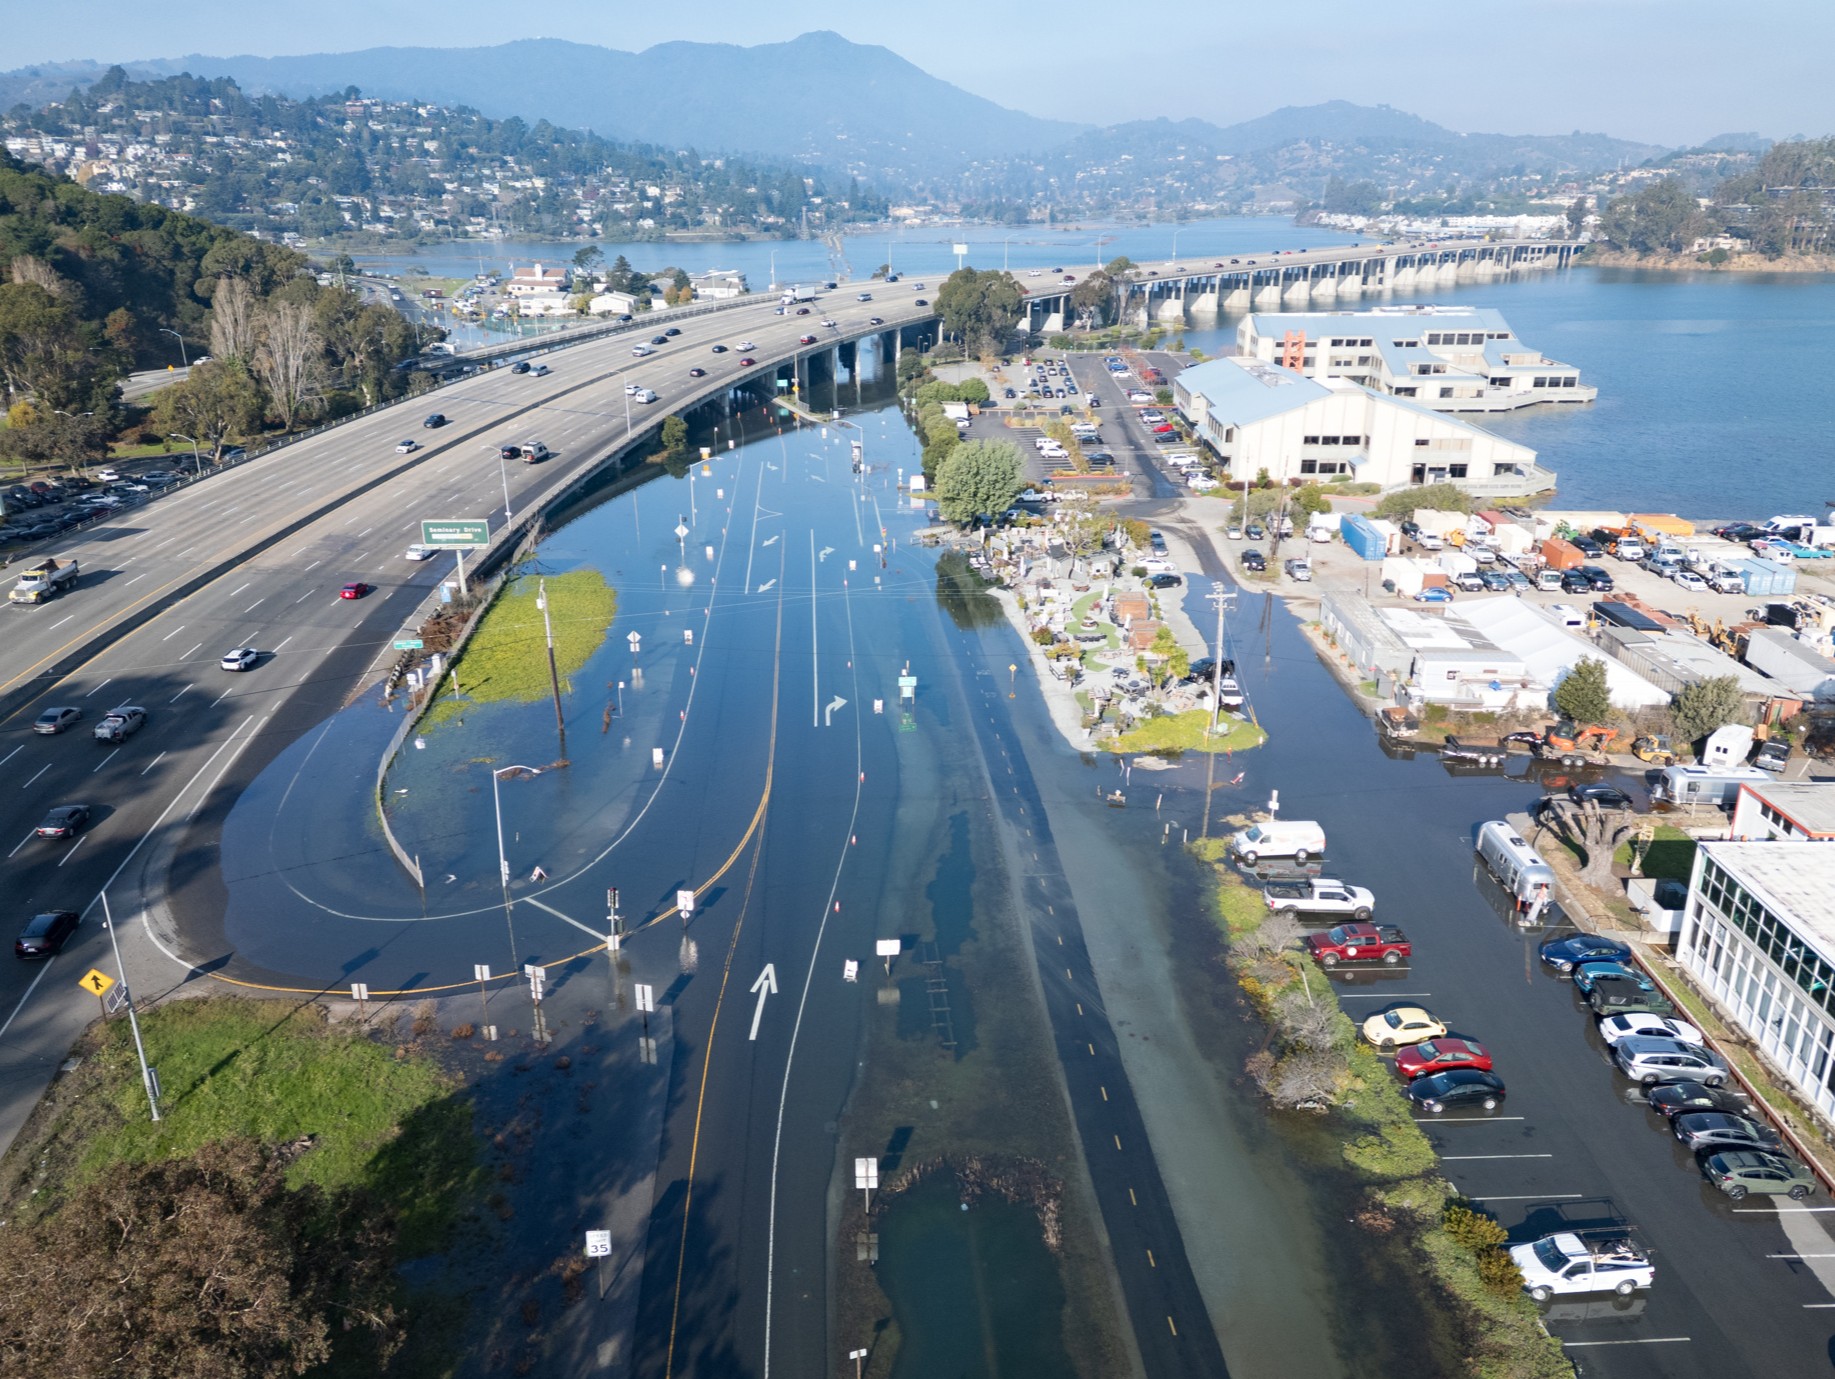
Hwy 101 and Hwy 1 Intersection, Mill Valley, 12/4/2025
Mill Valley-Sausalito Multi-Use Trail, 1/2/2026
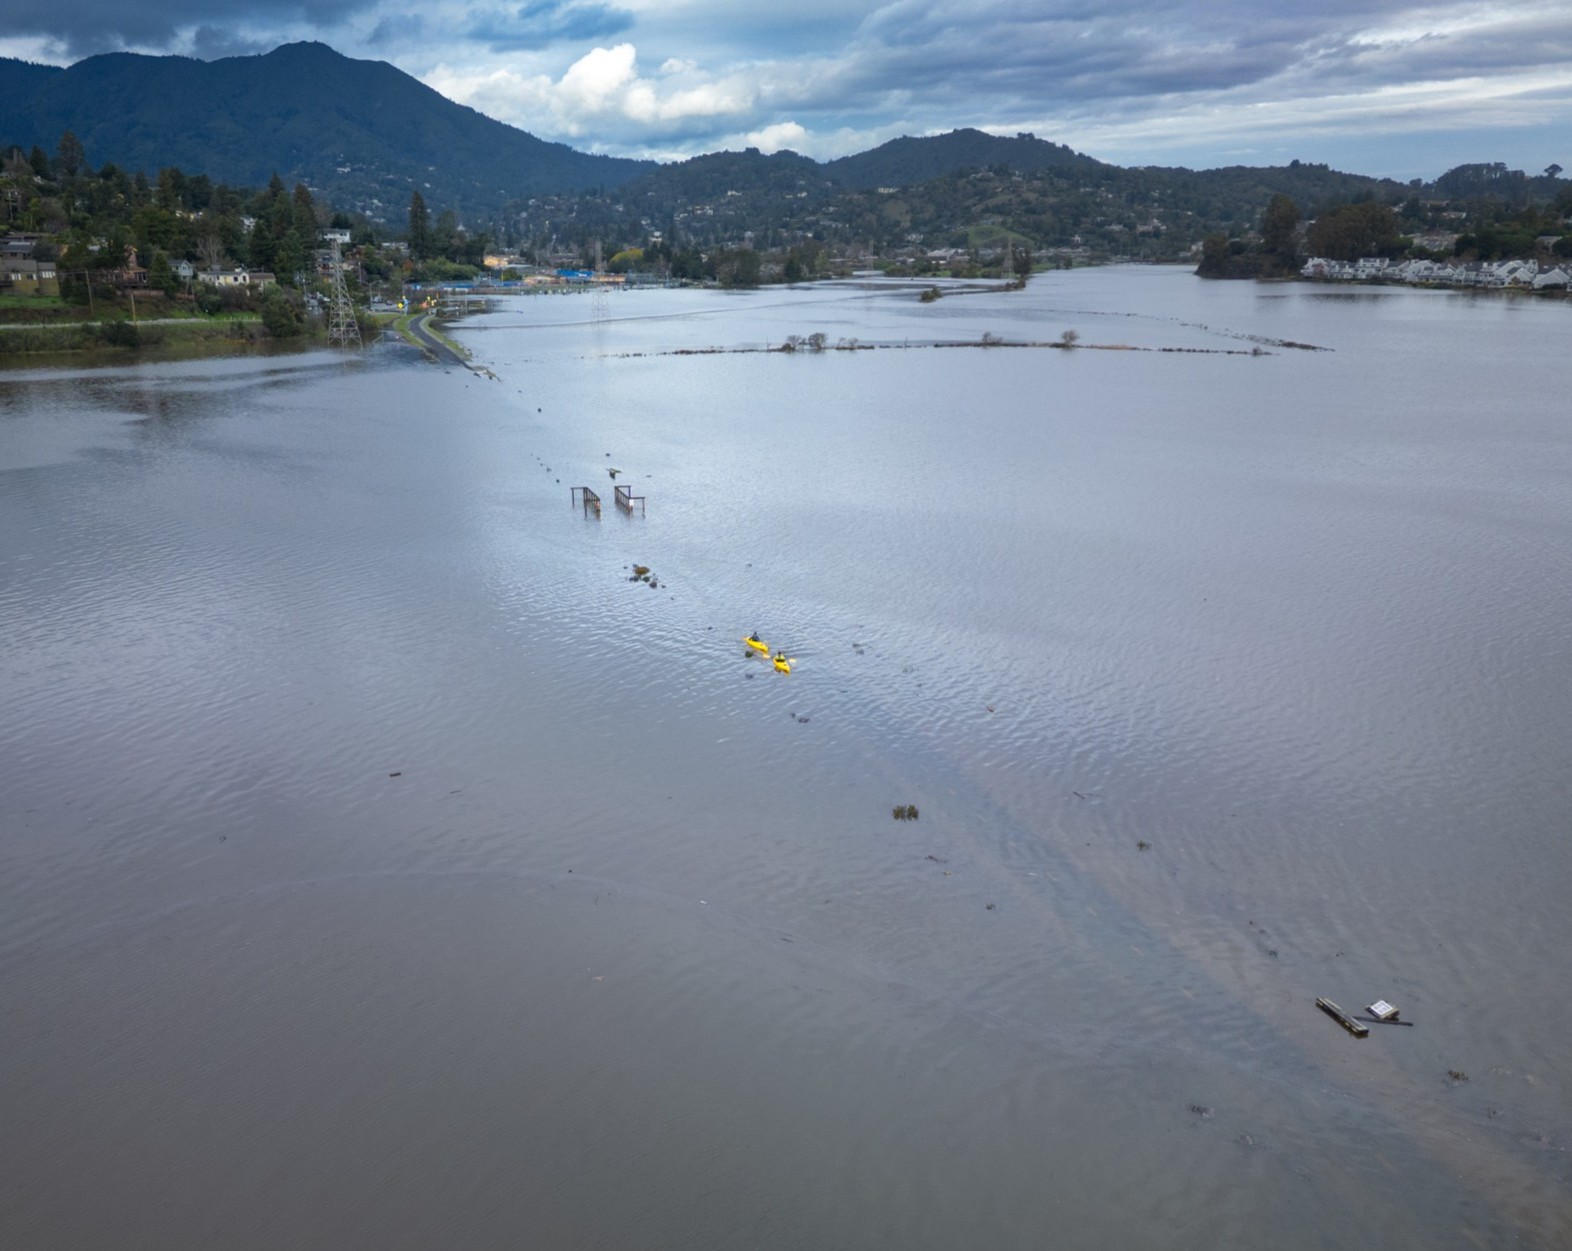
Meadow and Vendola, San Rafael, 1/3/2026
Calle del Arroyo, Stinson Beach, 11/5/2025
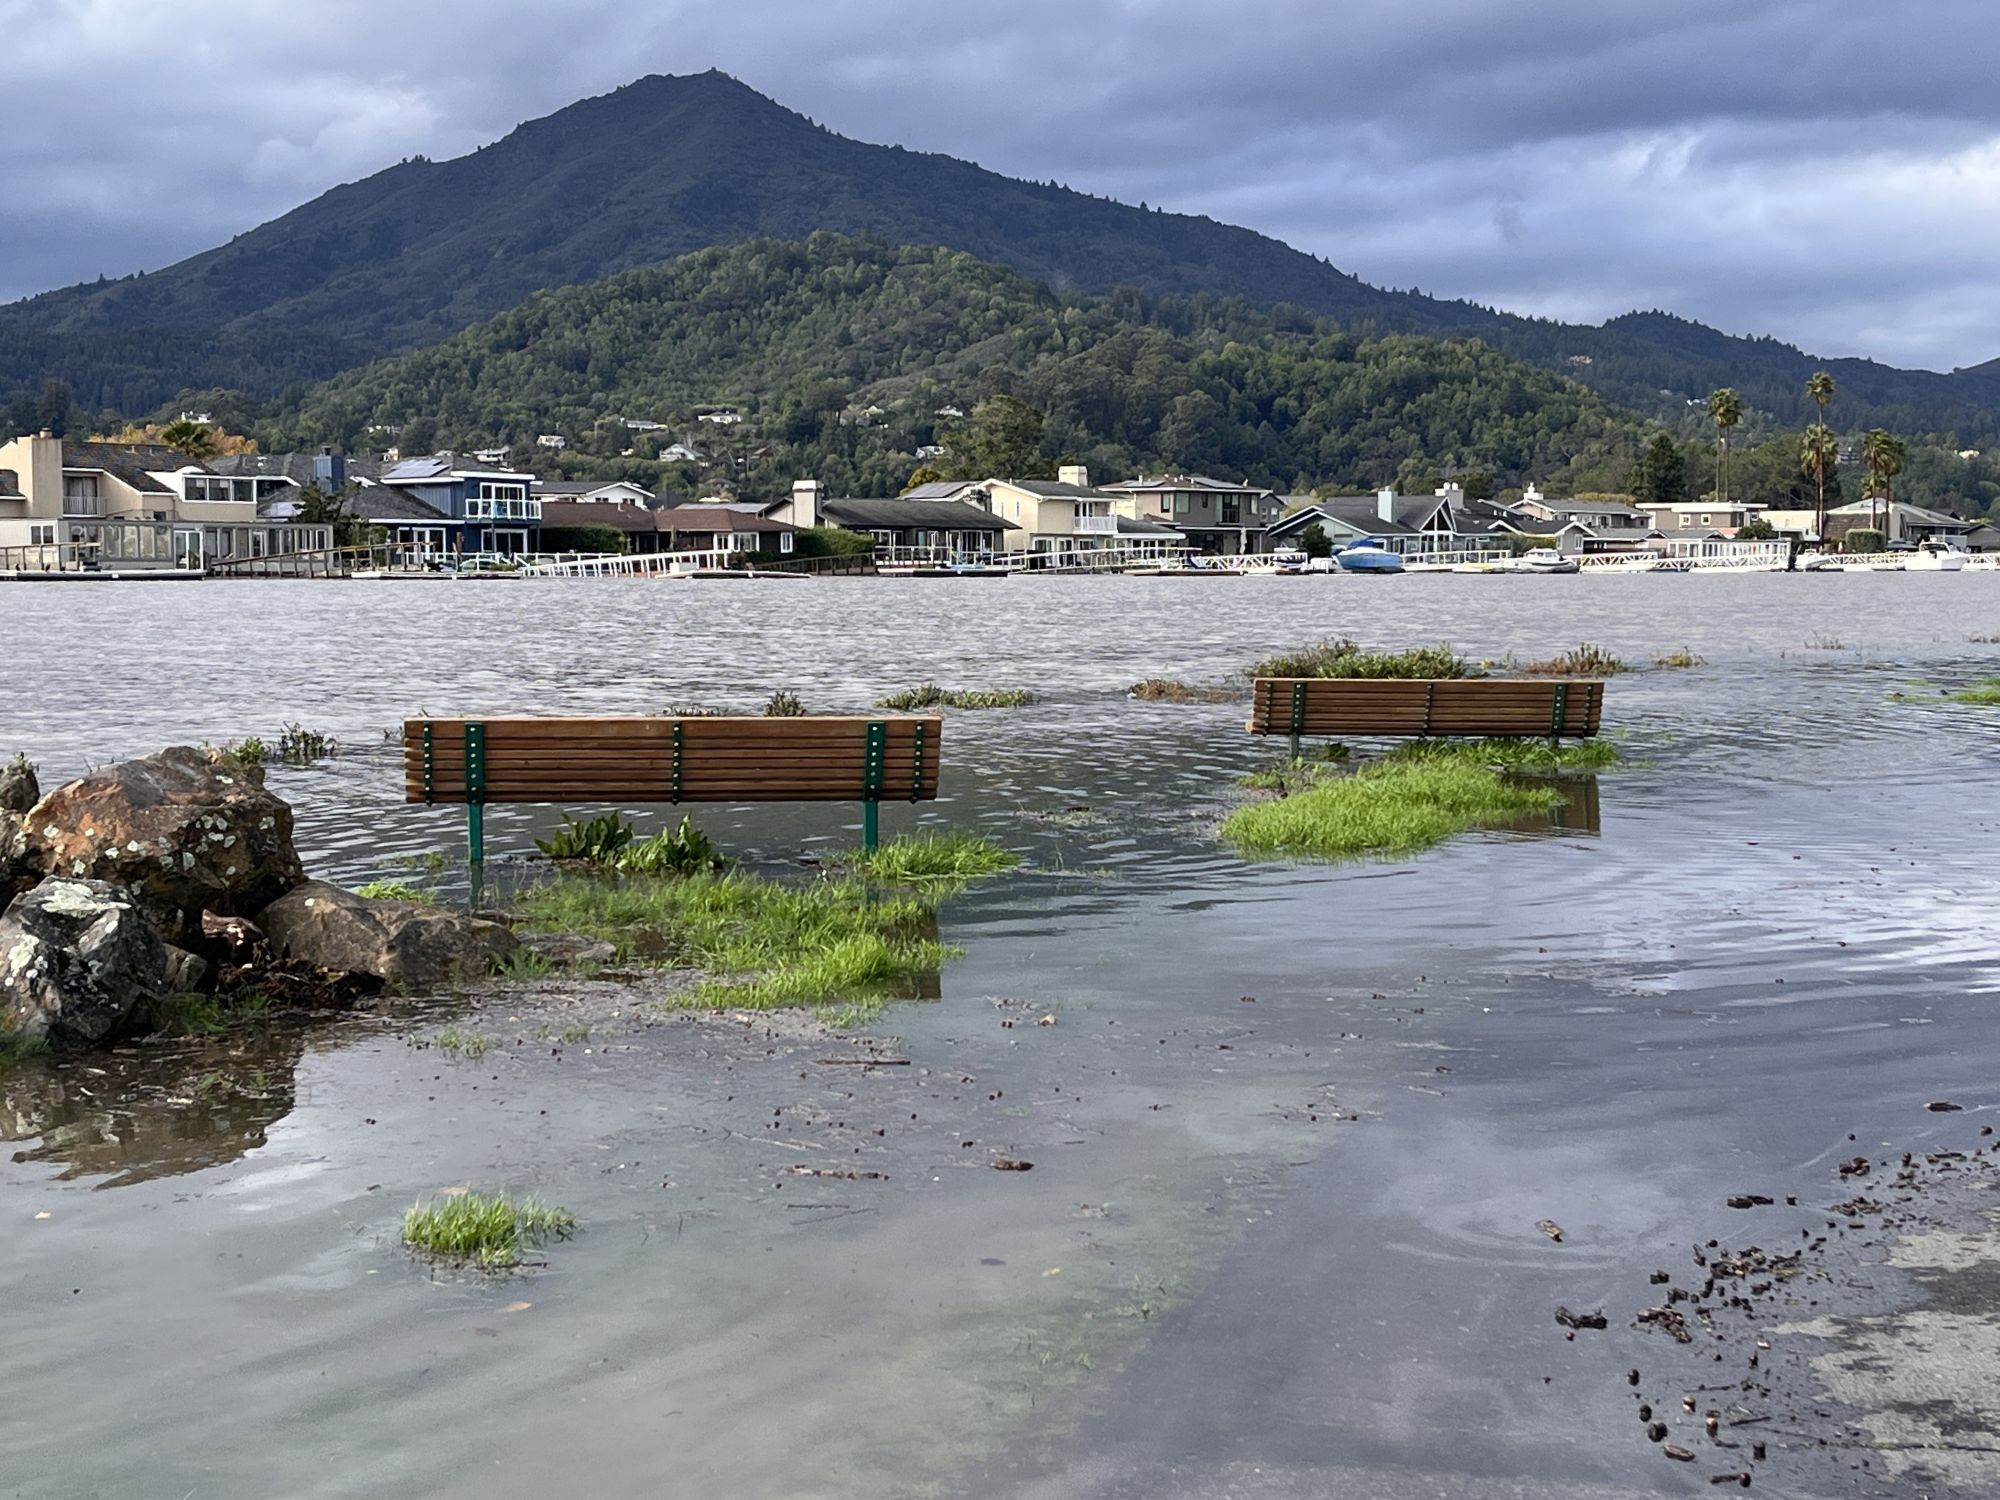
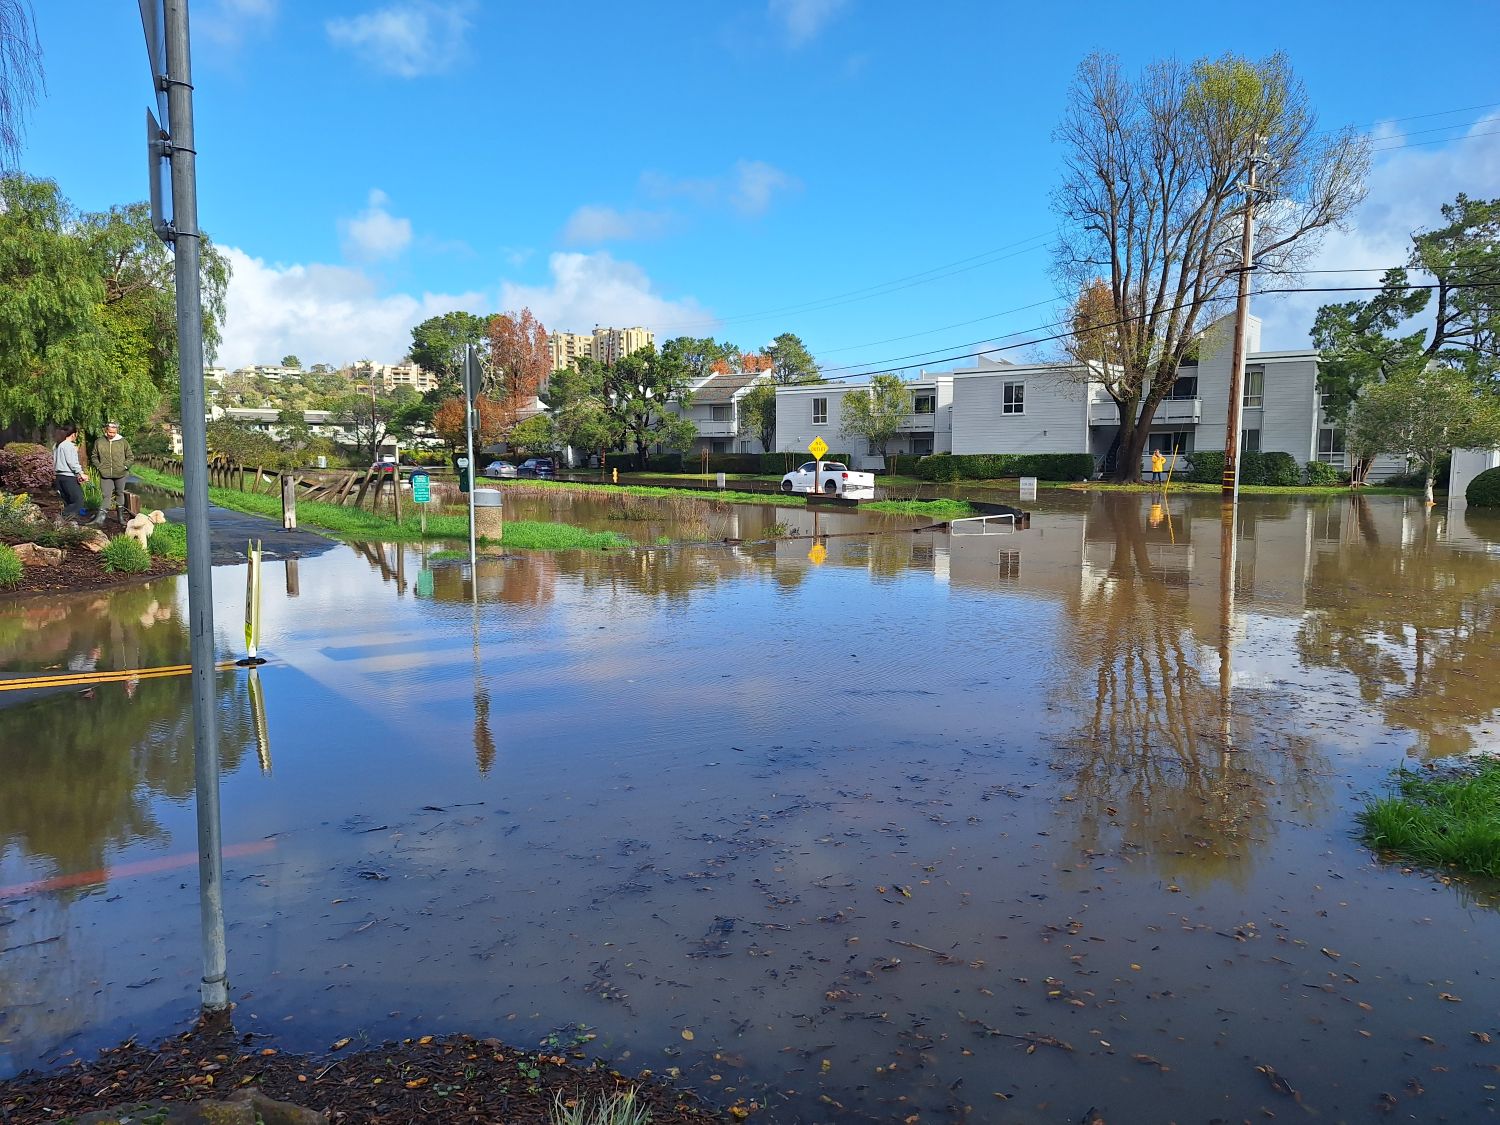
Niven Park, Greenbrae, 1/2/2026
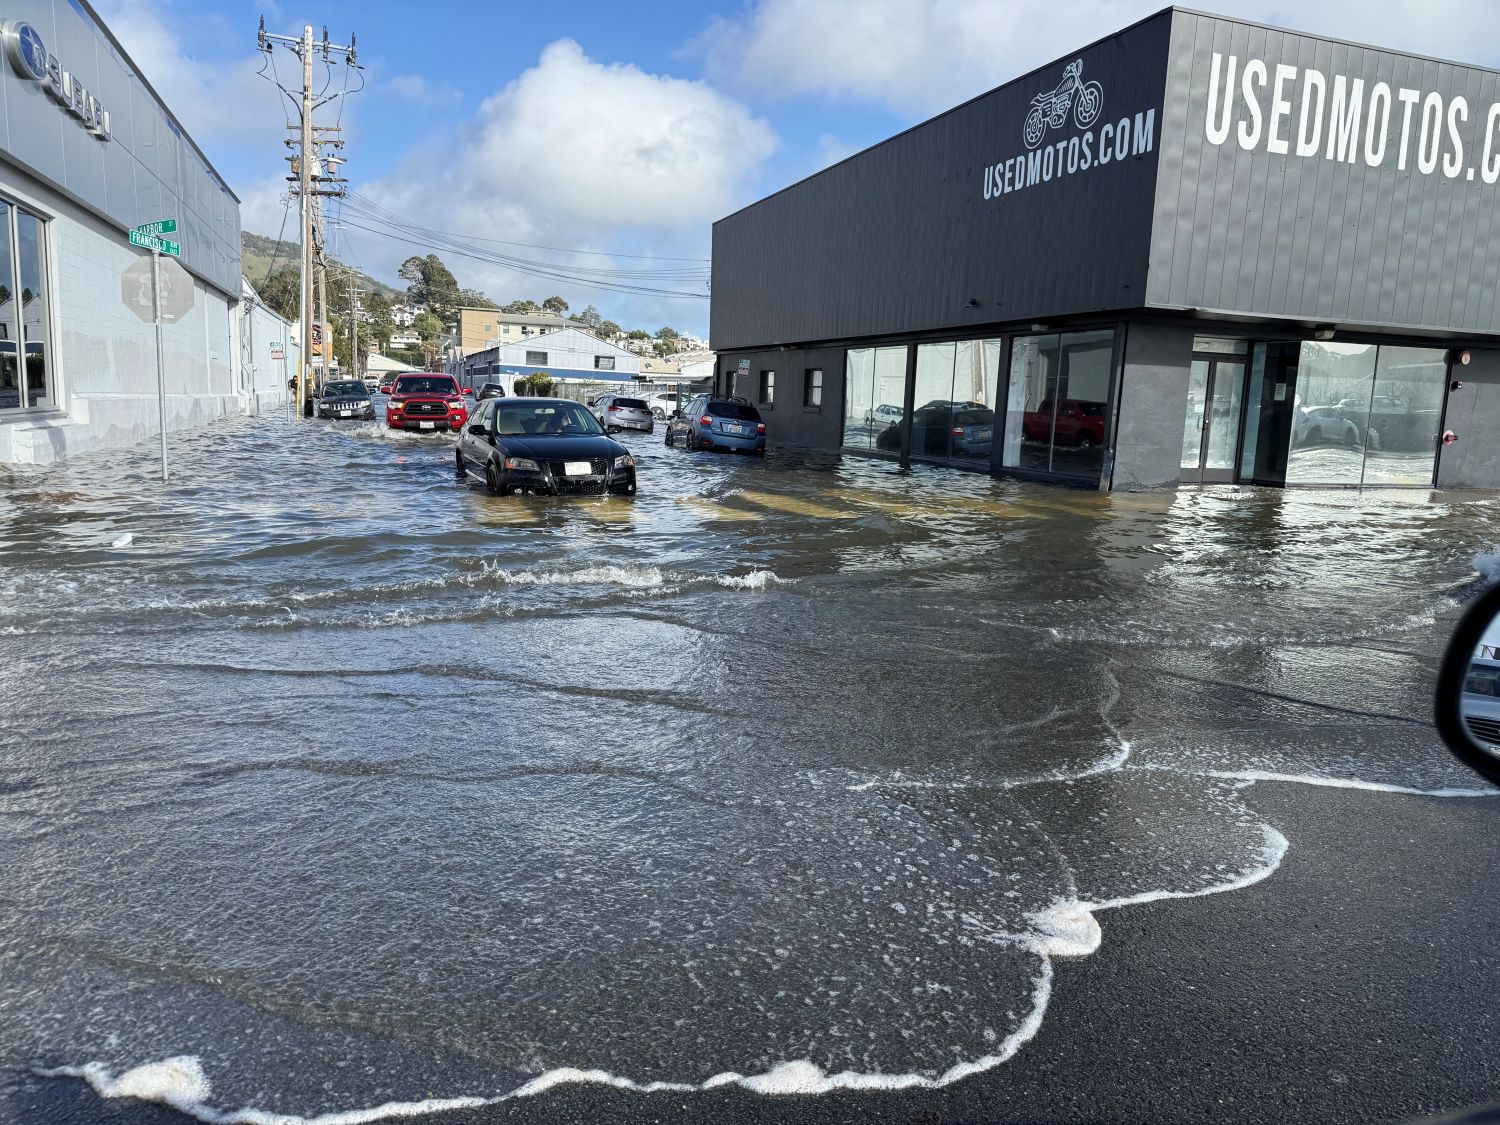
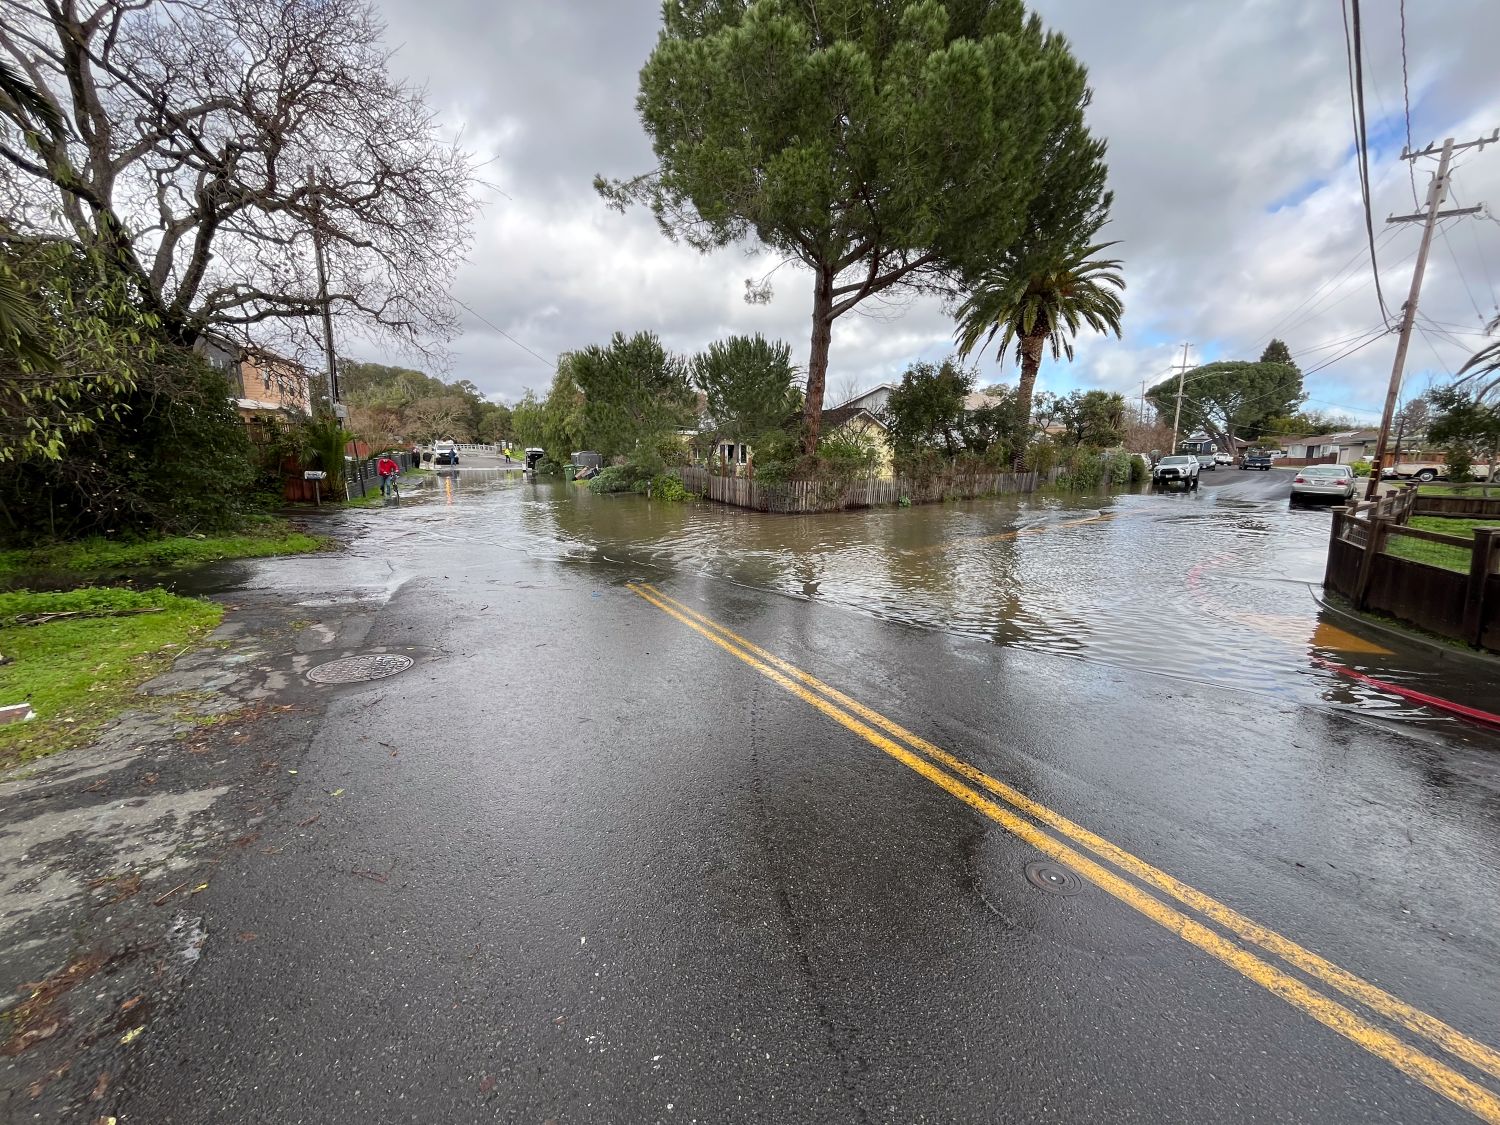
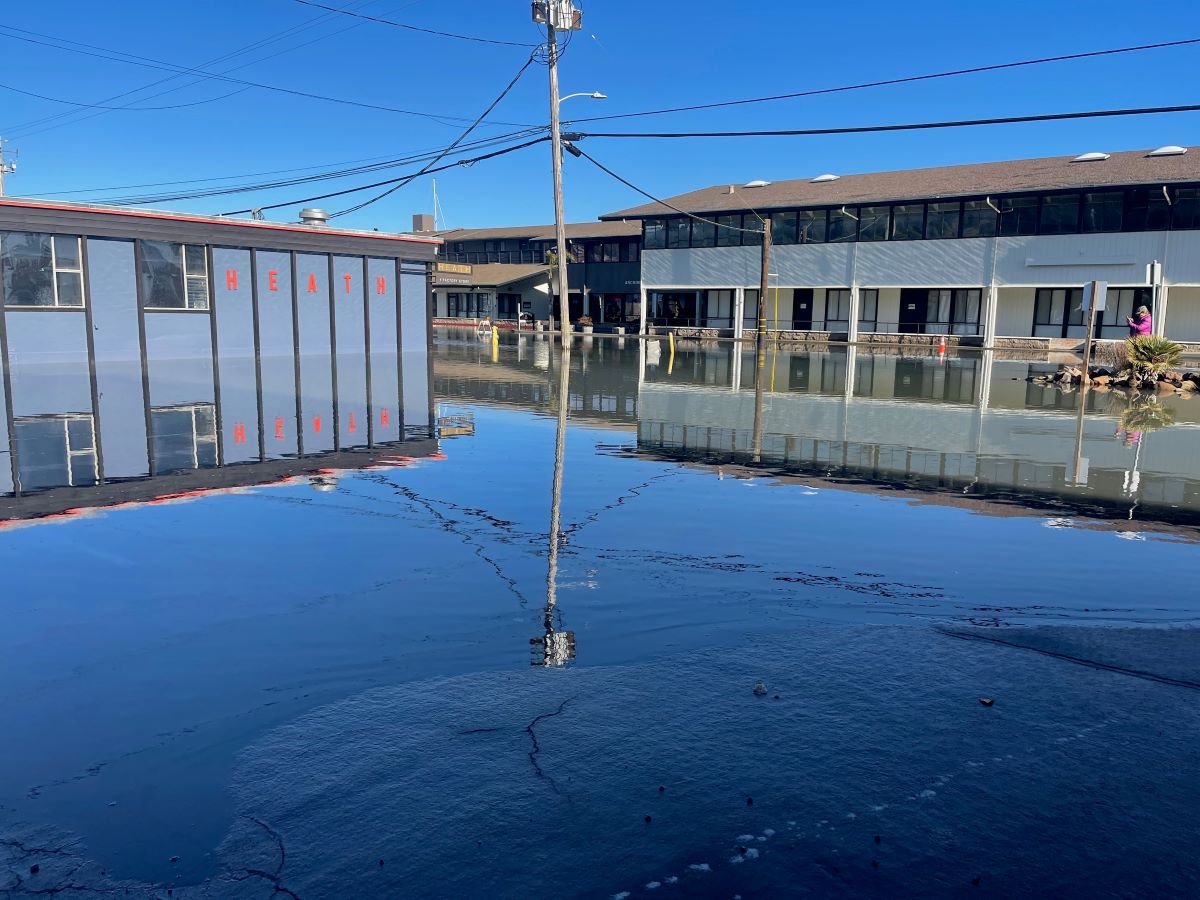
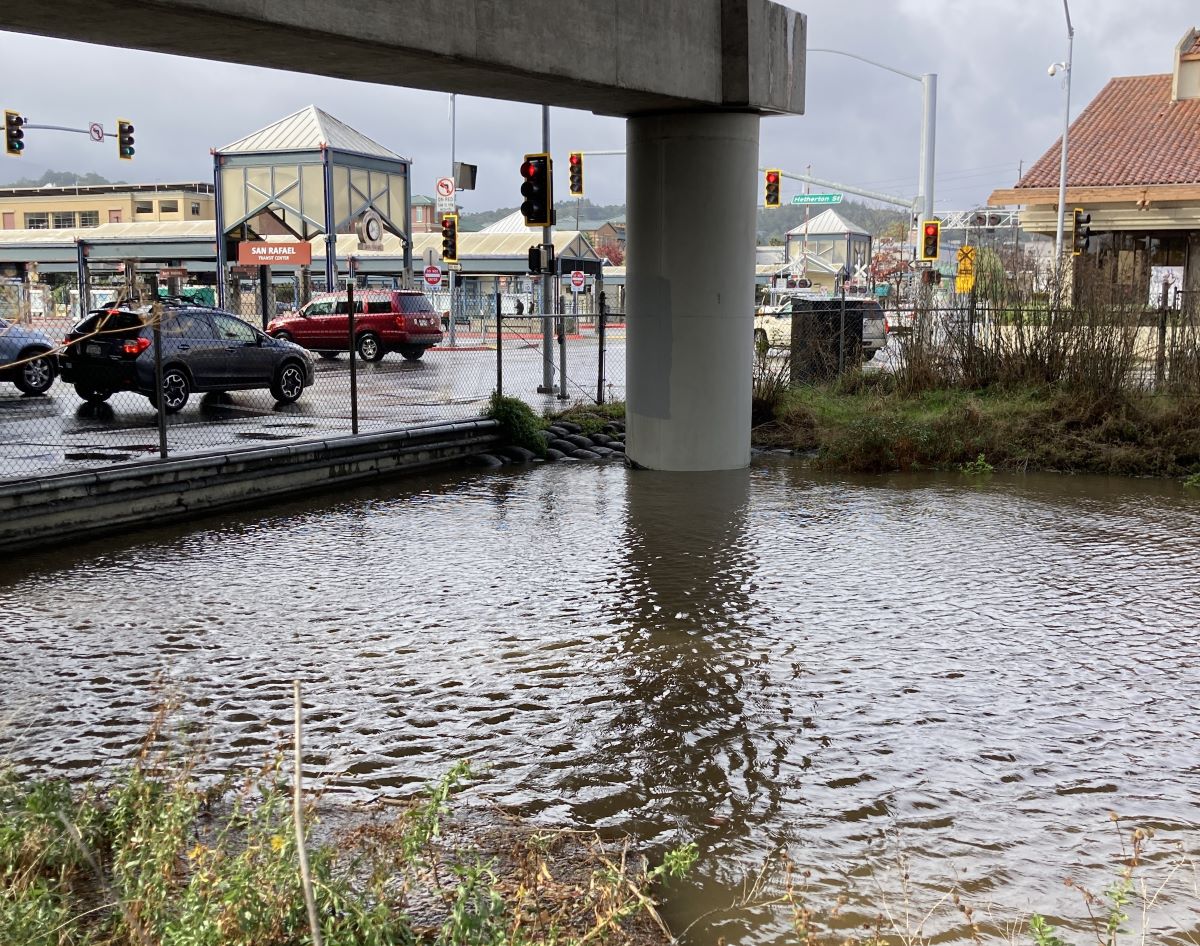
Francisco Blvd E and Harbor Street, San Rafael, 1/3/2026
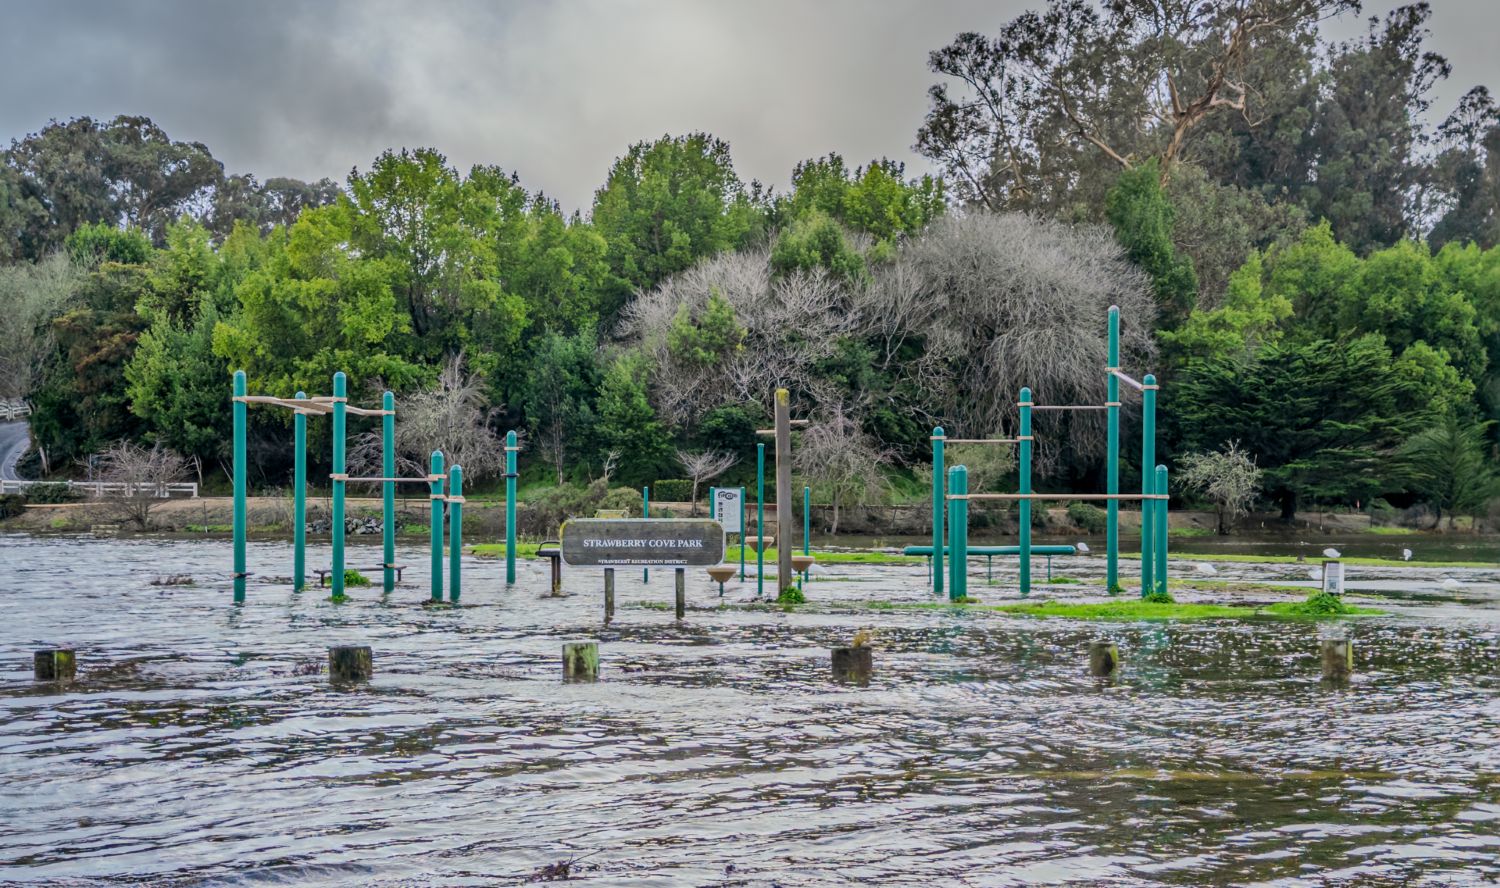
Strawberry Cove Playground, Mill Valley, 1/3/2026
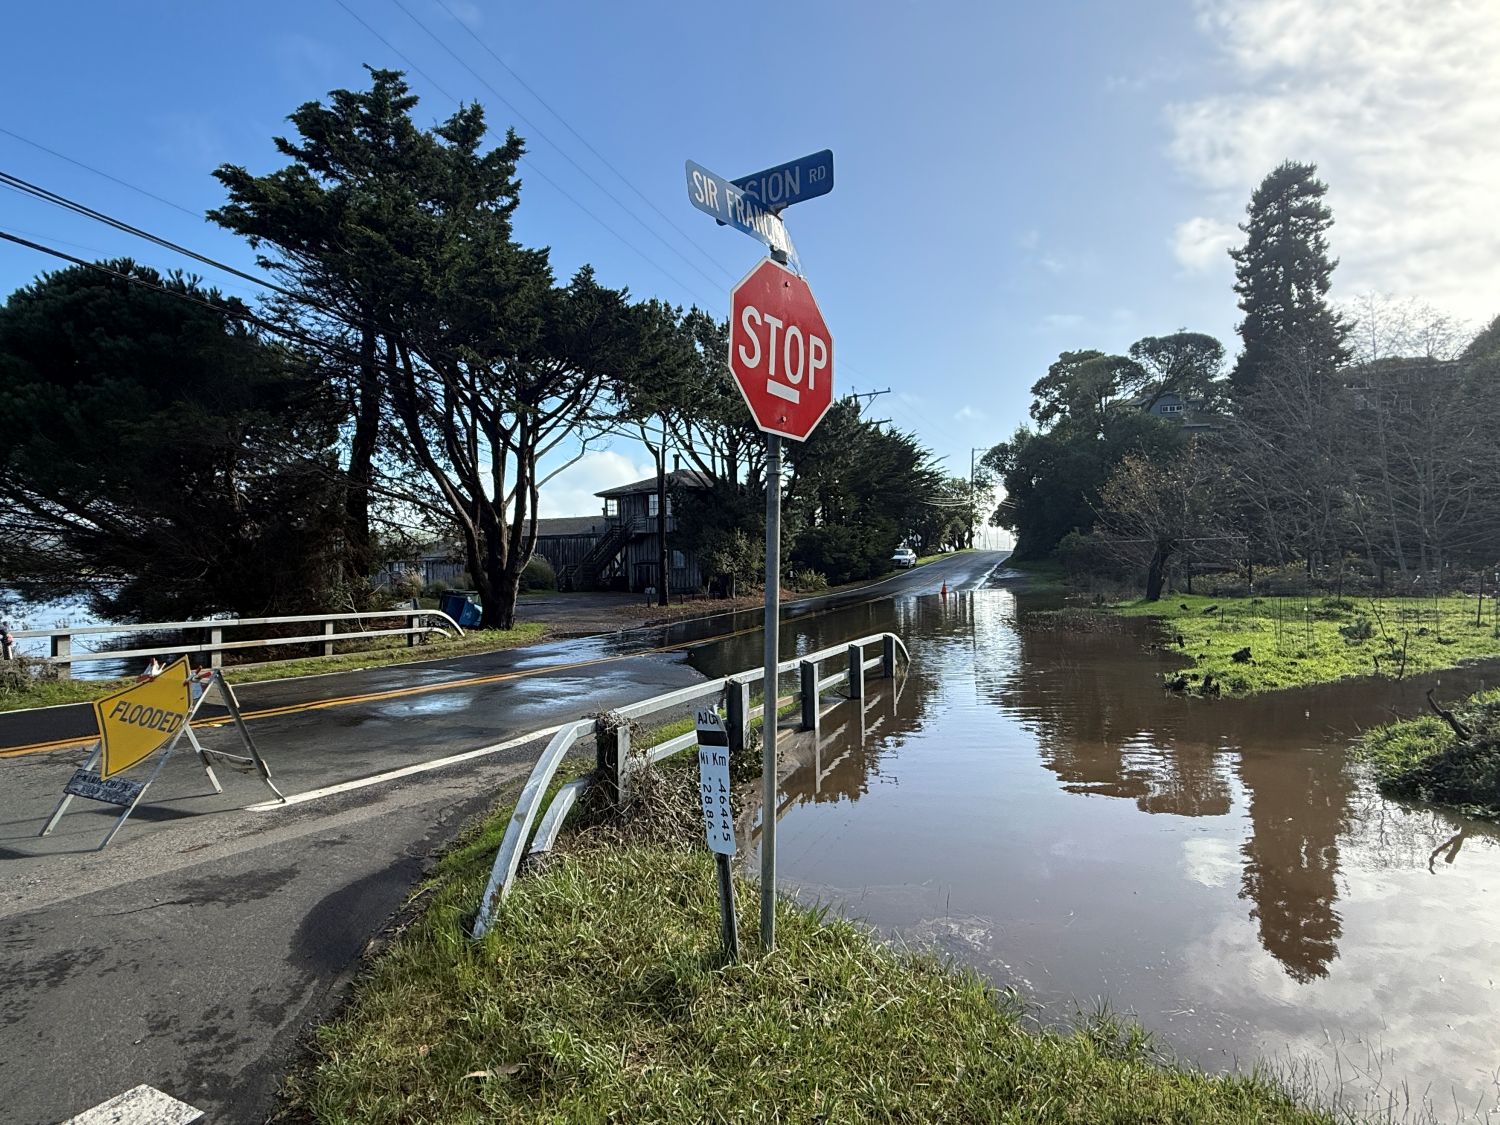
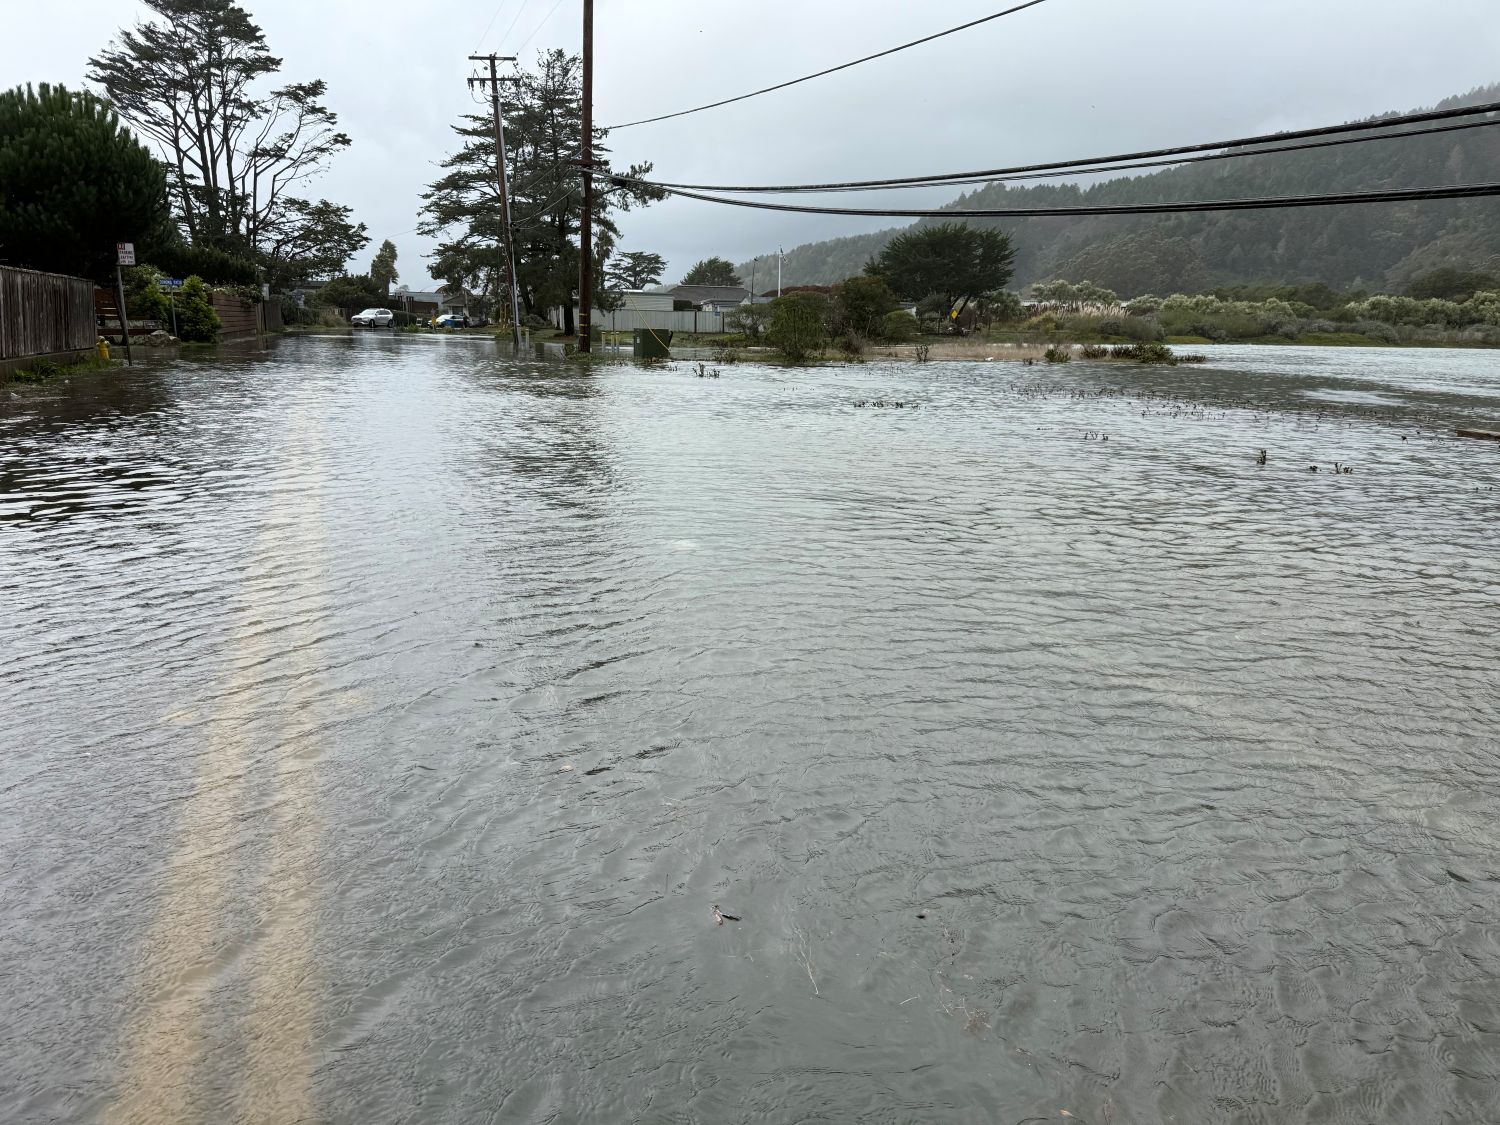
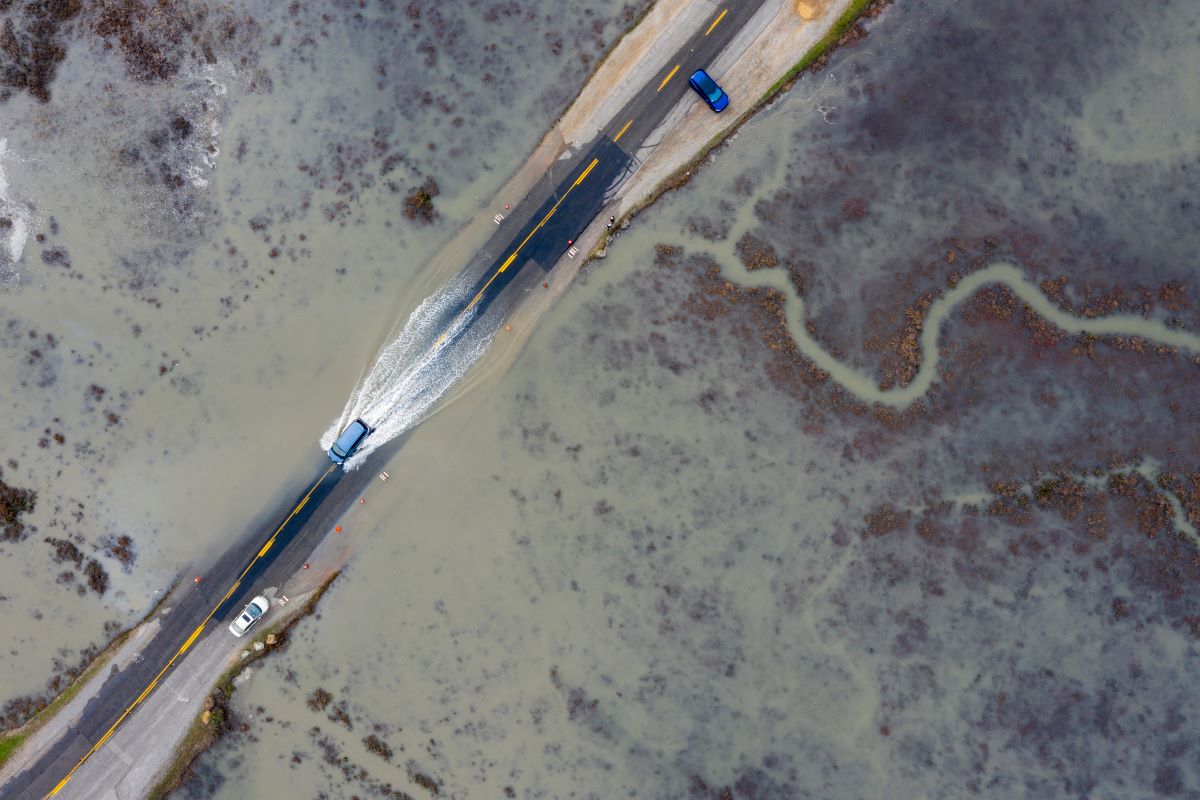
Vision Road at Sir Francisc Drake BLVD, Inverness, 1/3/2026
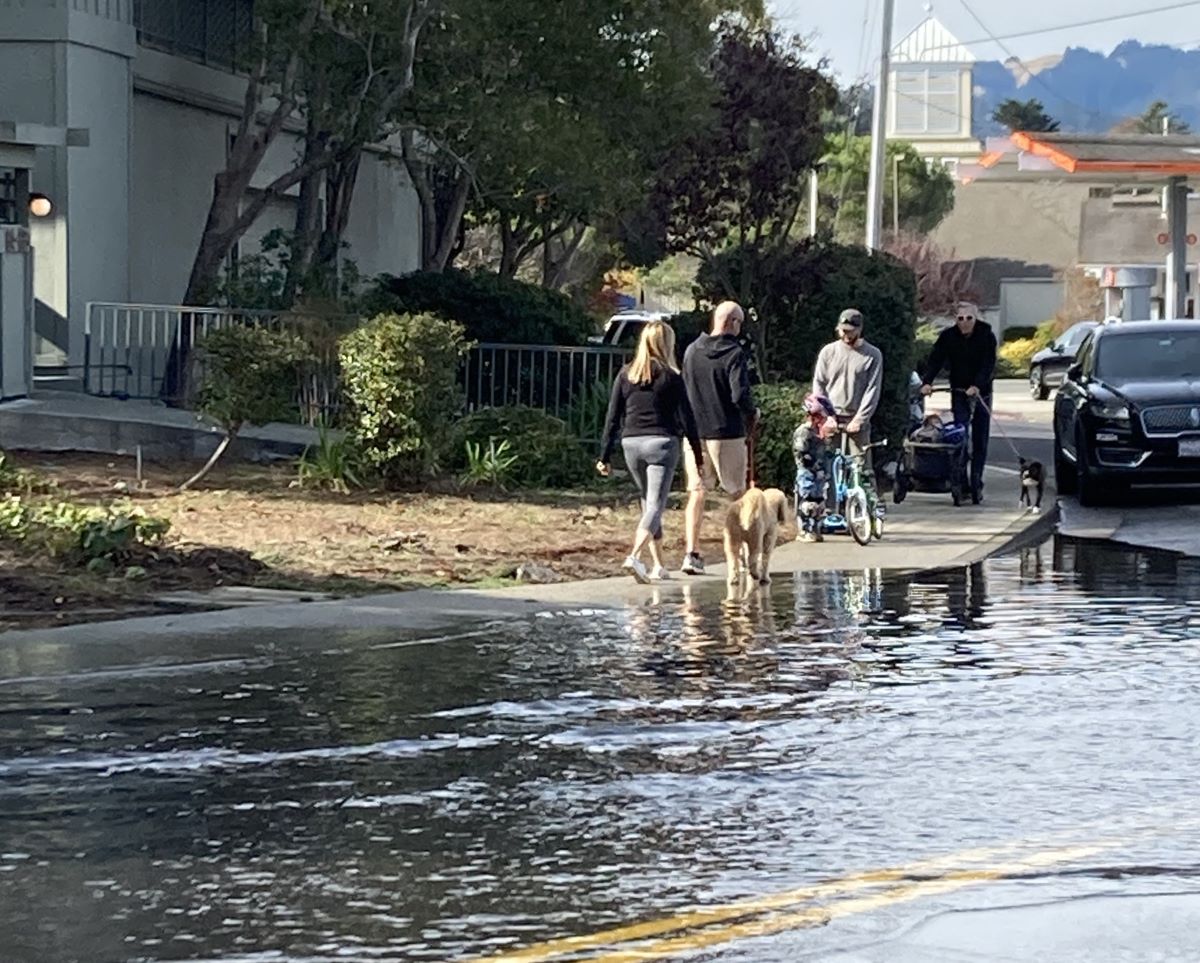
Larkspur Plaza Drive, Larkspur, 1/3/2026
Barbaree Way, Tiburon, 11/16/2024

Highway 1, Bolinas Lagoon, 11/16/2024
Gate 5 Road, Sausalito, 11/15/2024
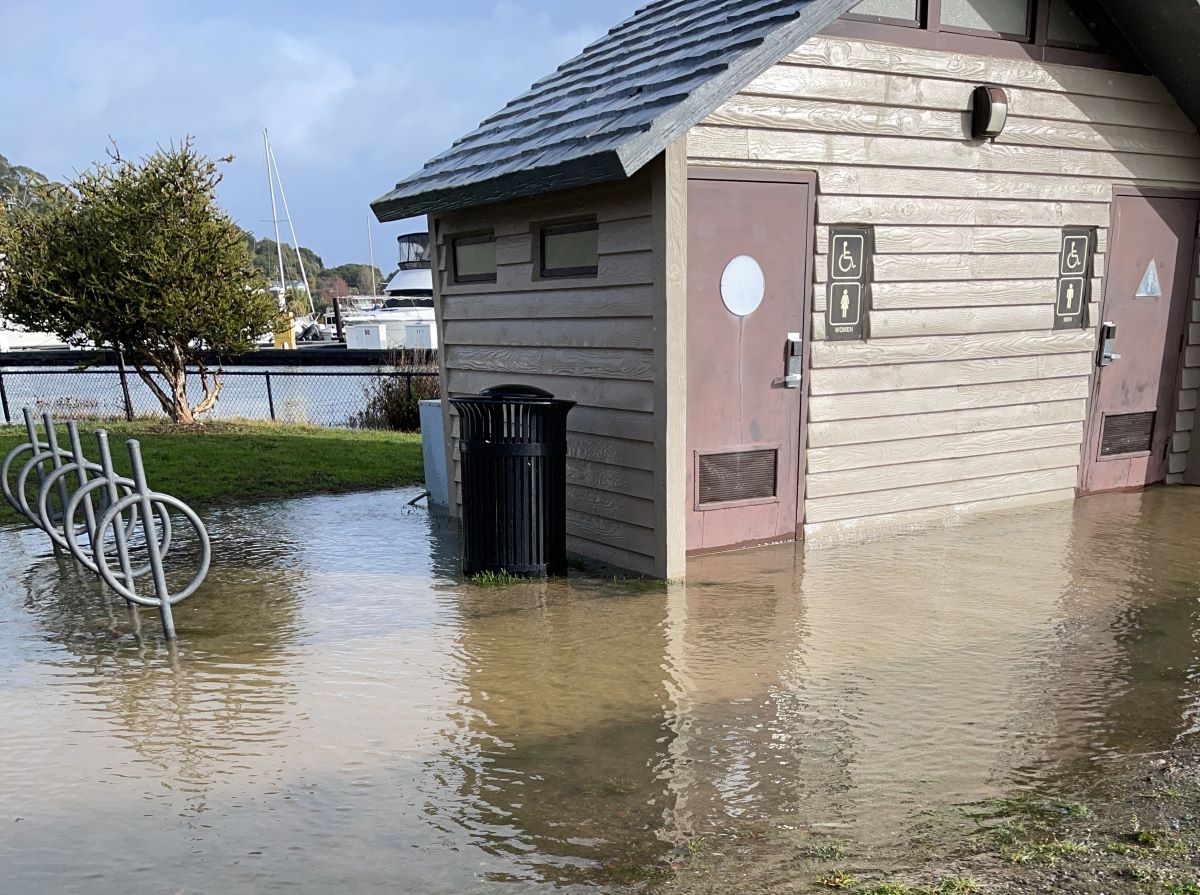
San Rafael Creek, San Rafael, 12/14/2024
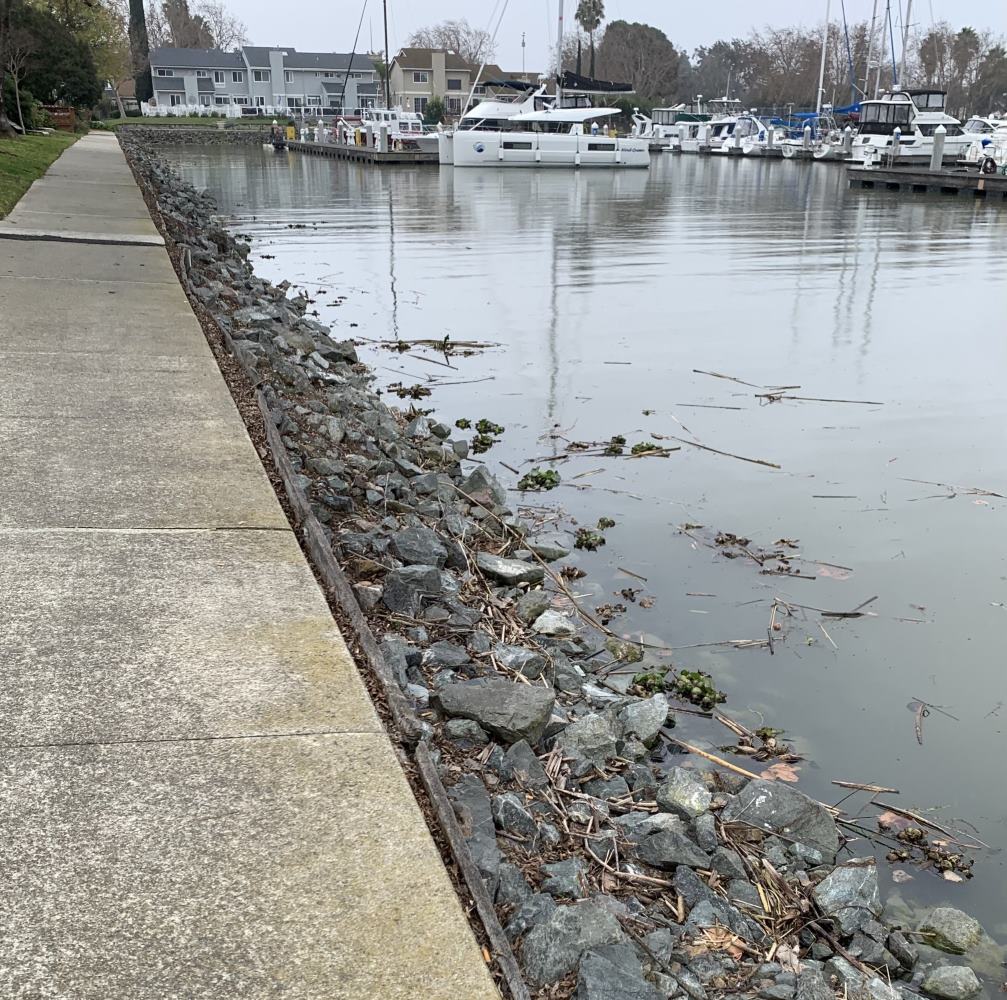
Loch Lomond Drive, San Rafael, 12/14/2024
North San Pedro Road, China Camp State Park, 12/23/2022
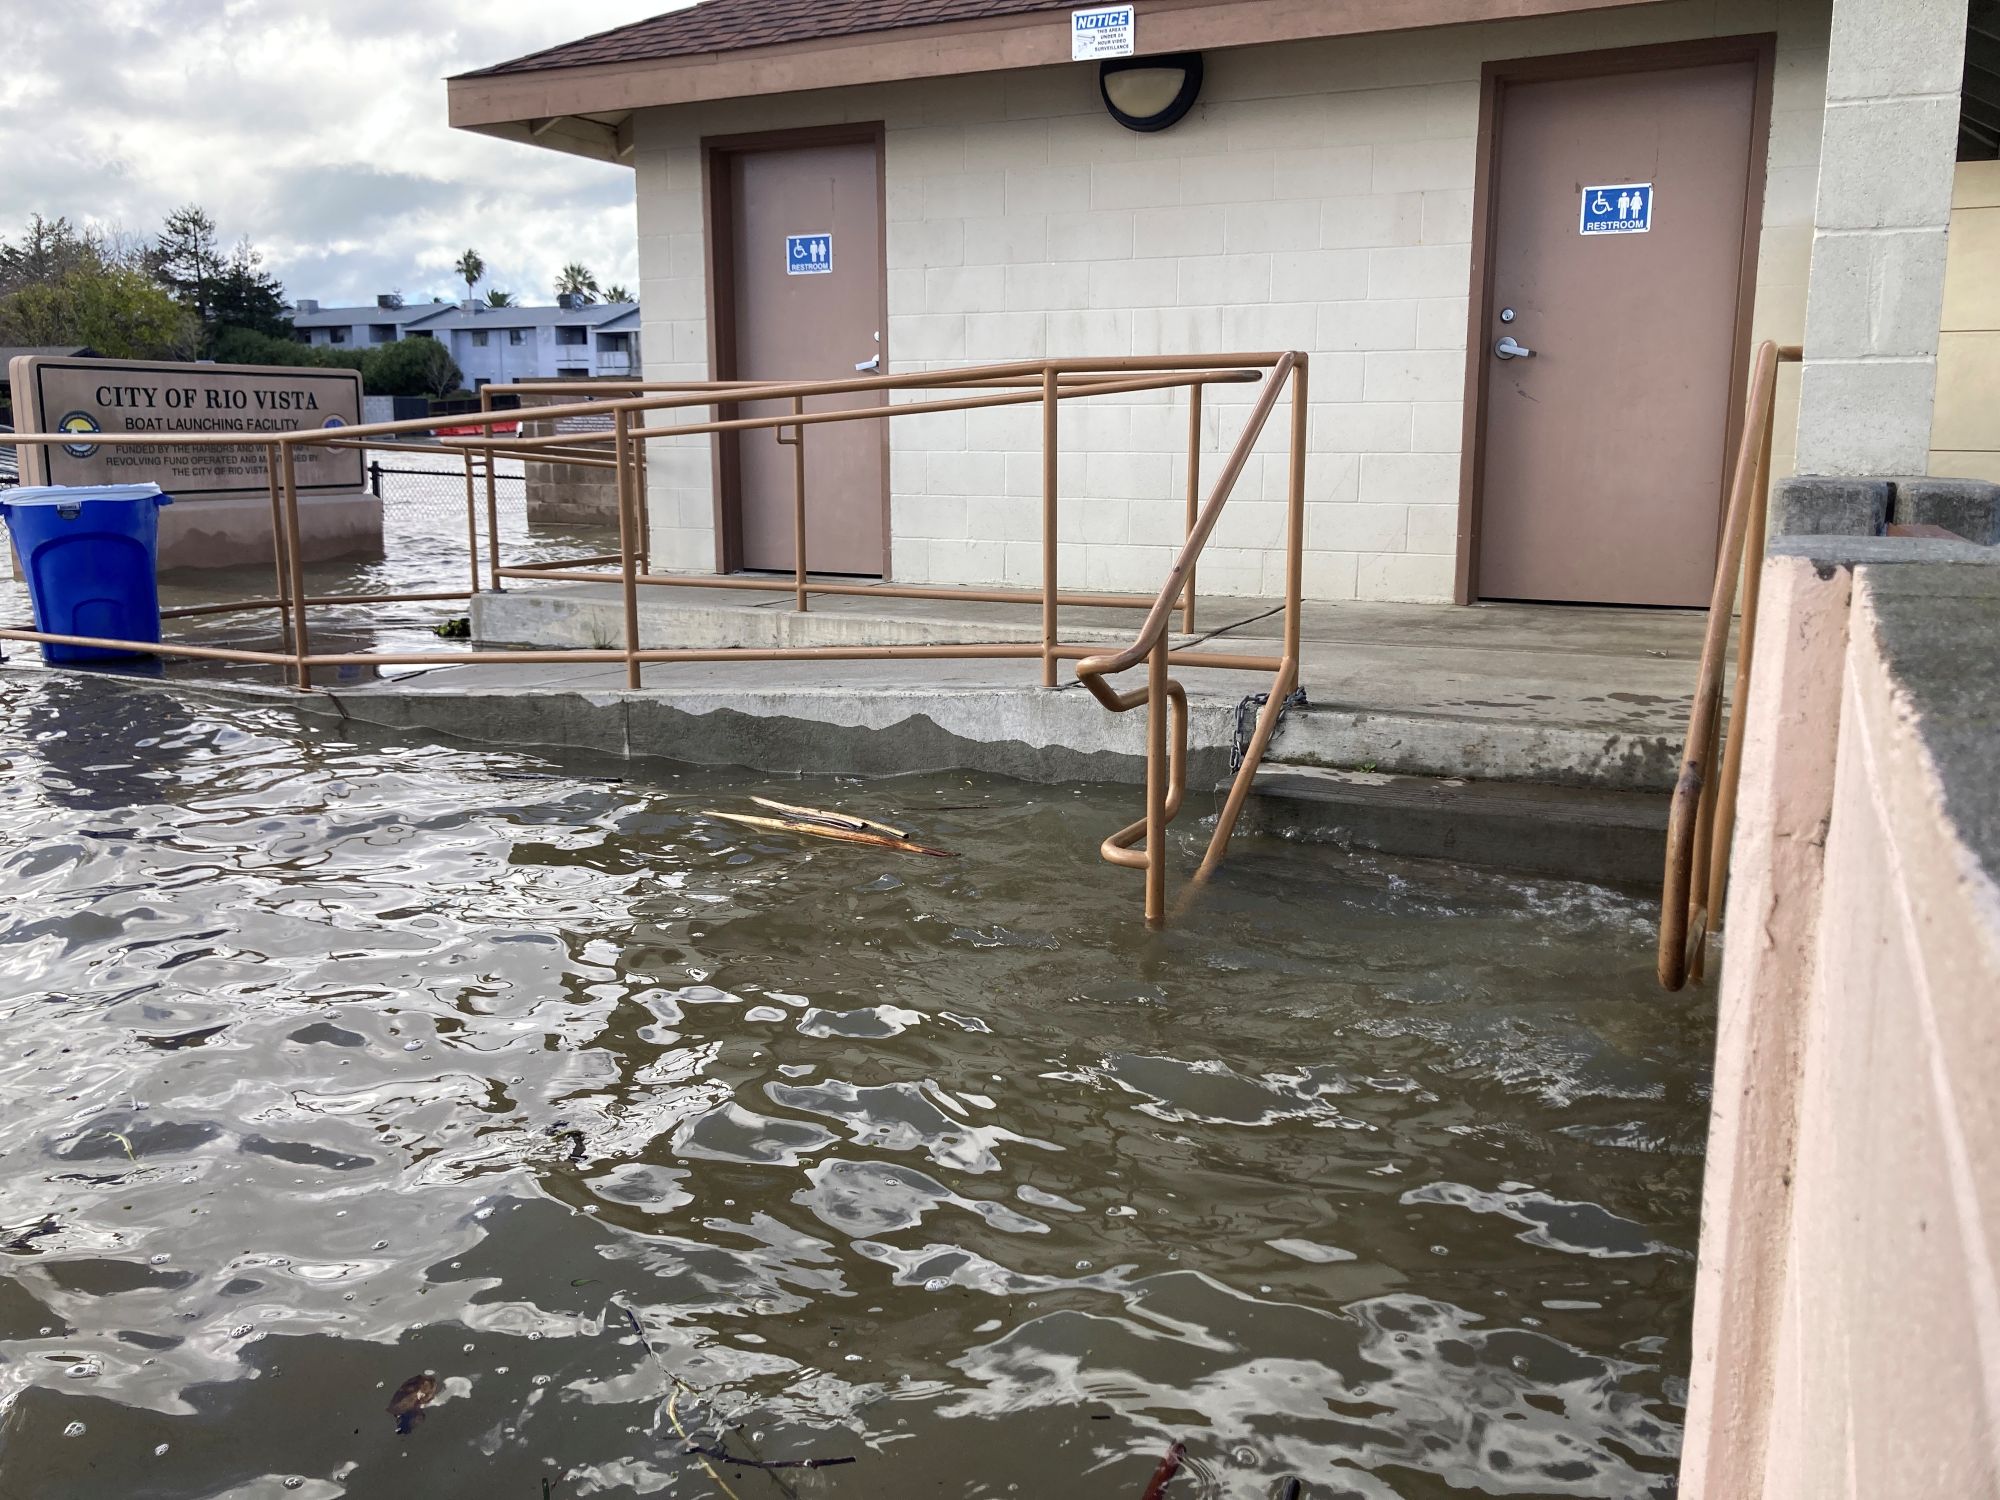
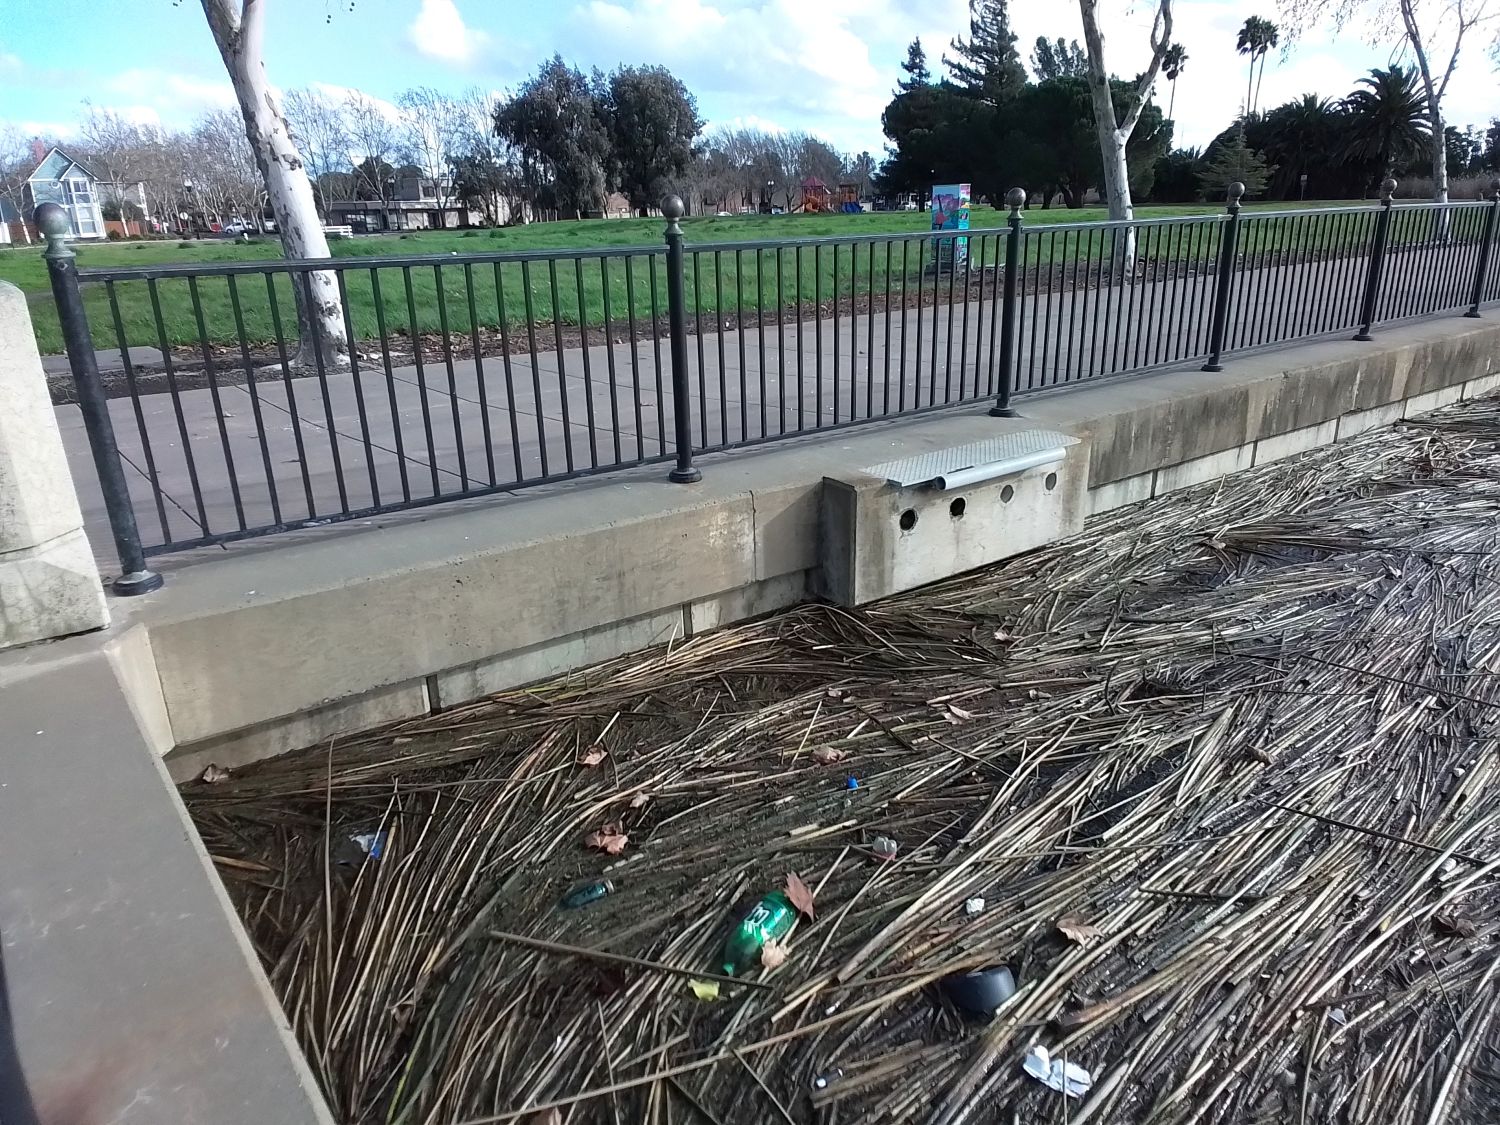
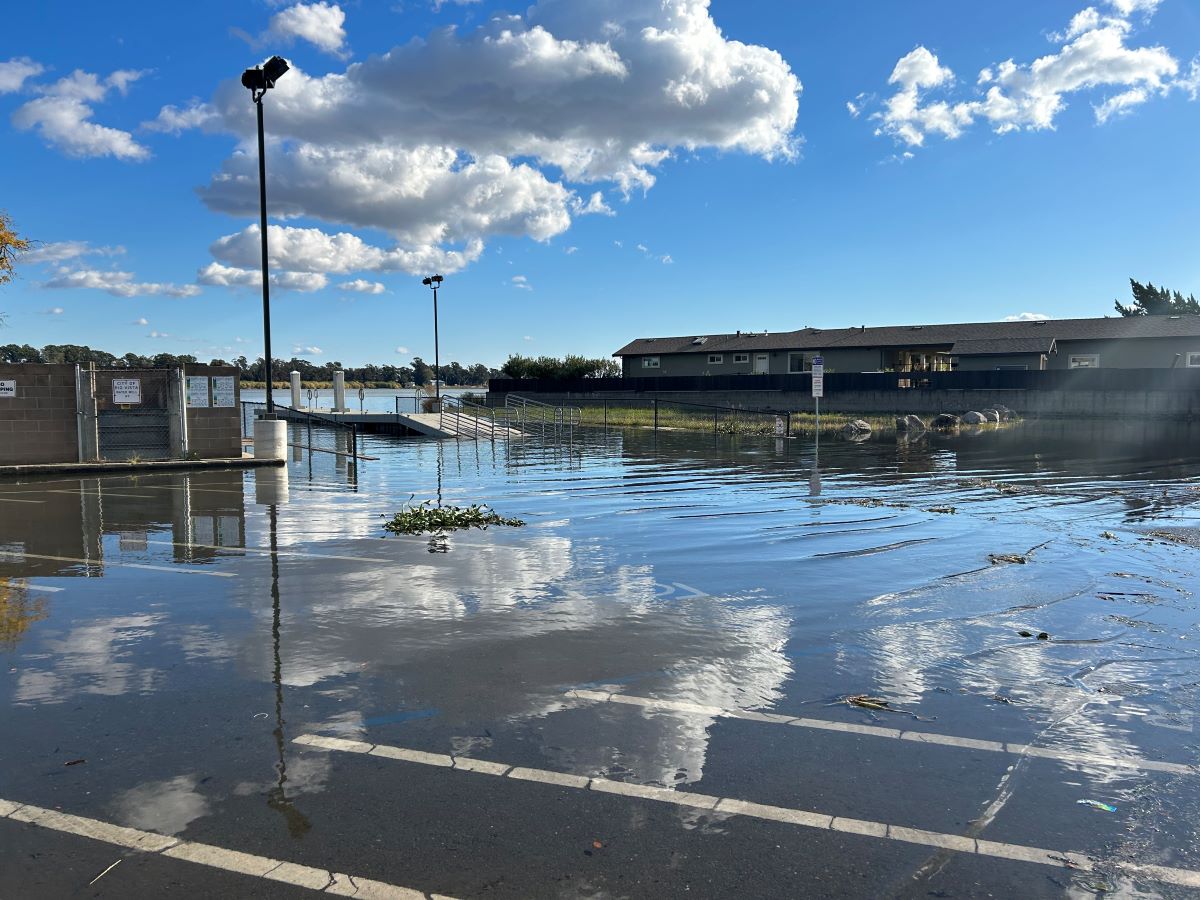
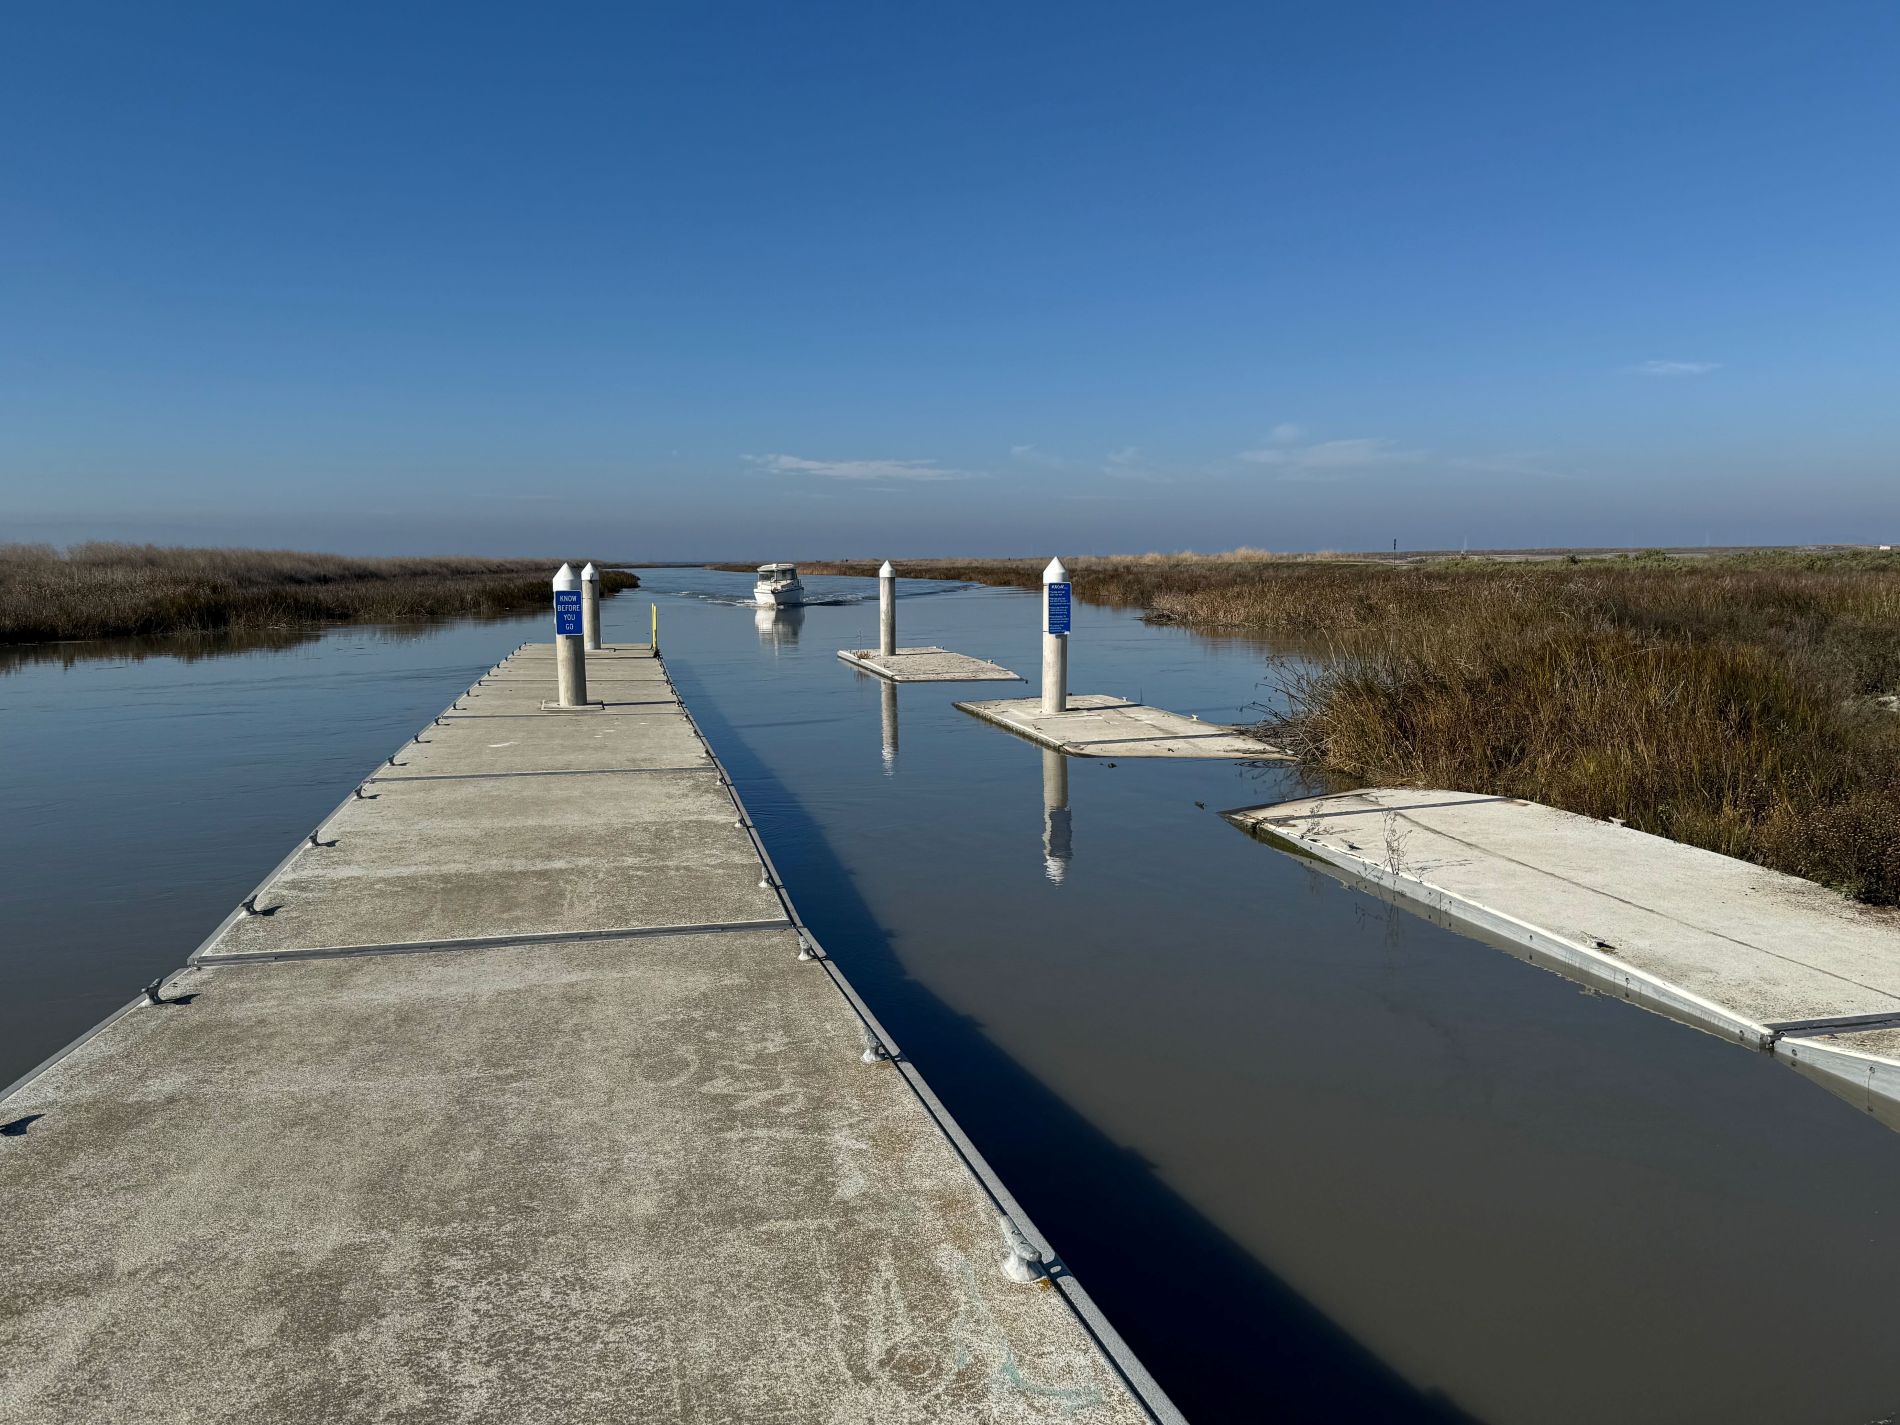
Public Boat Launch next to City Hall, Rio Vista, 1/3/2026
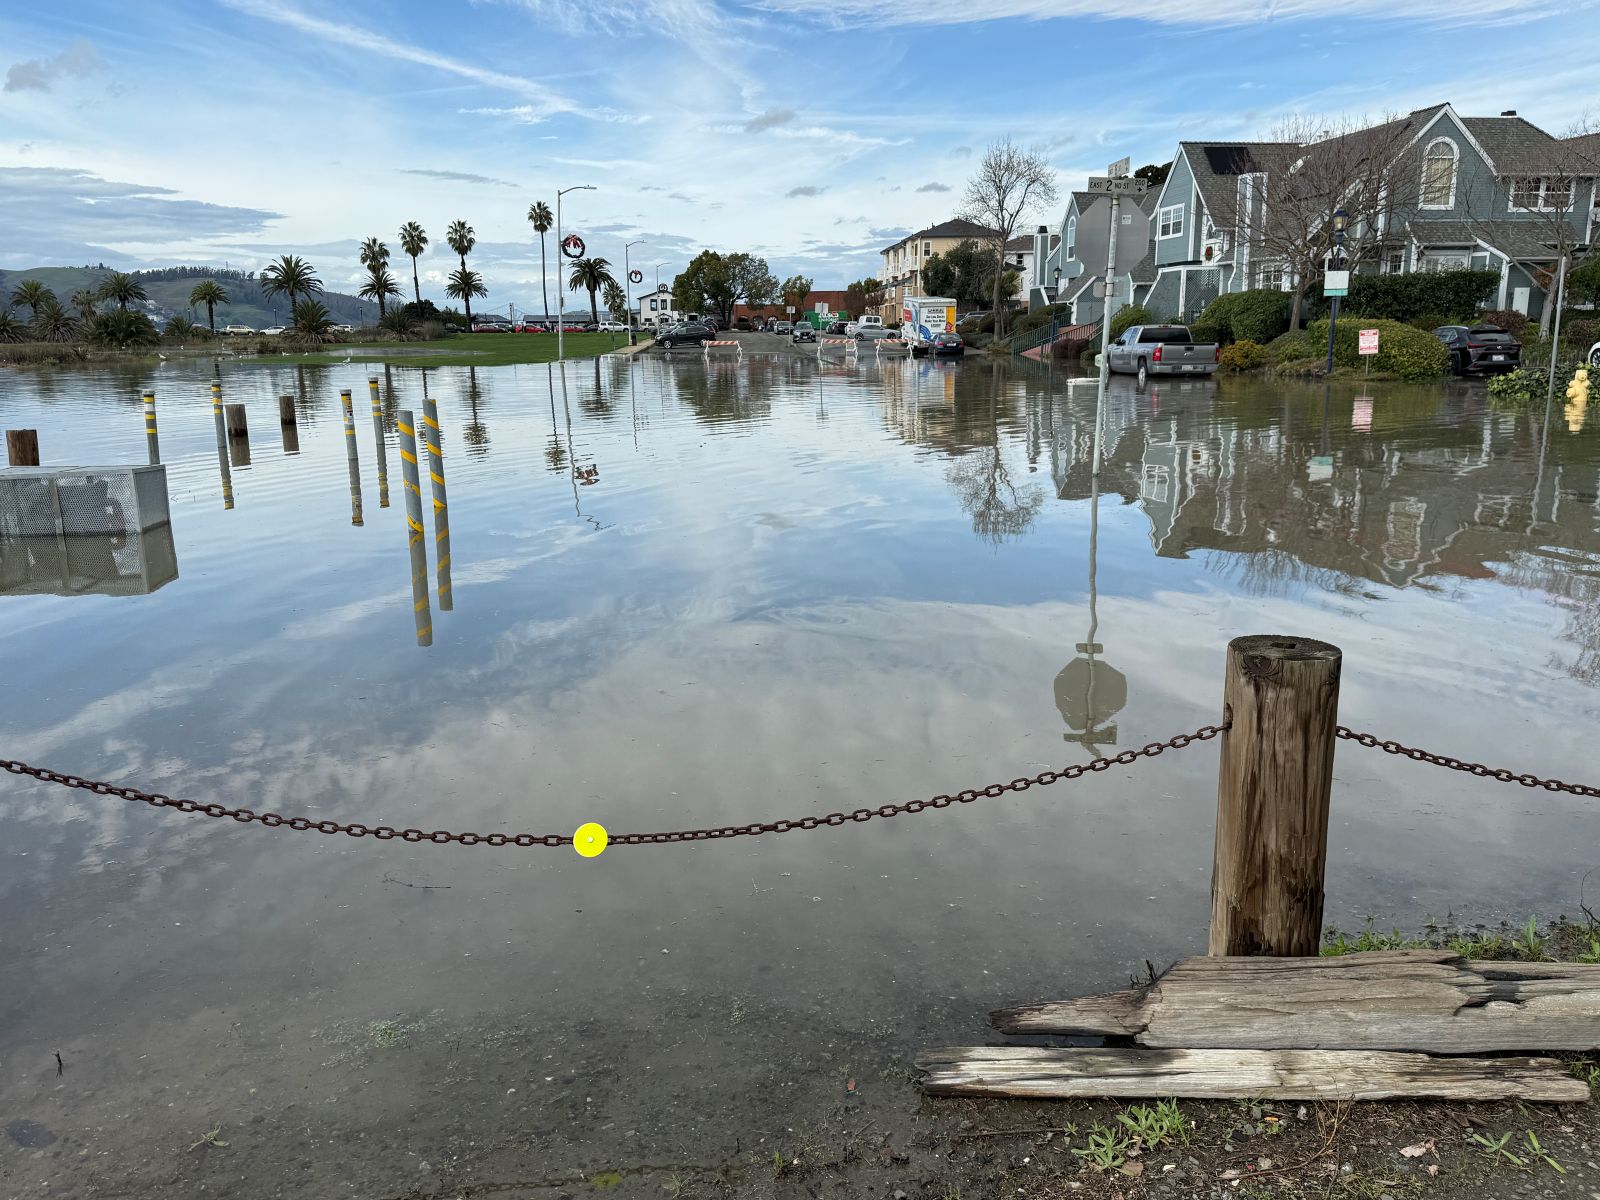
East 2nd Street and East B Street, Benicia, 1/2/2026
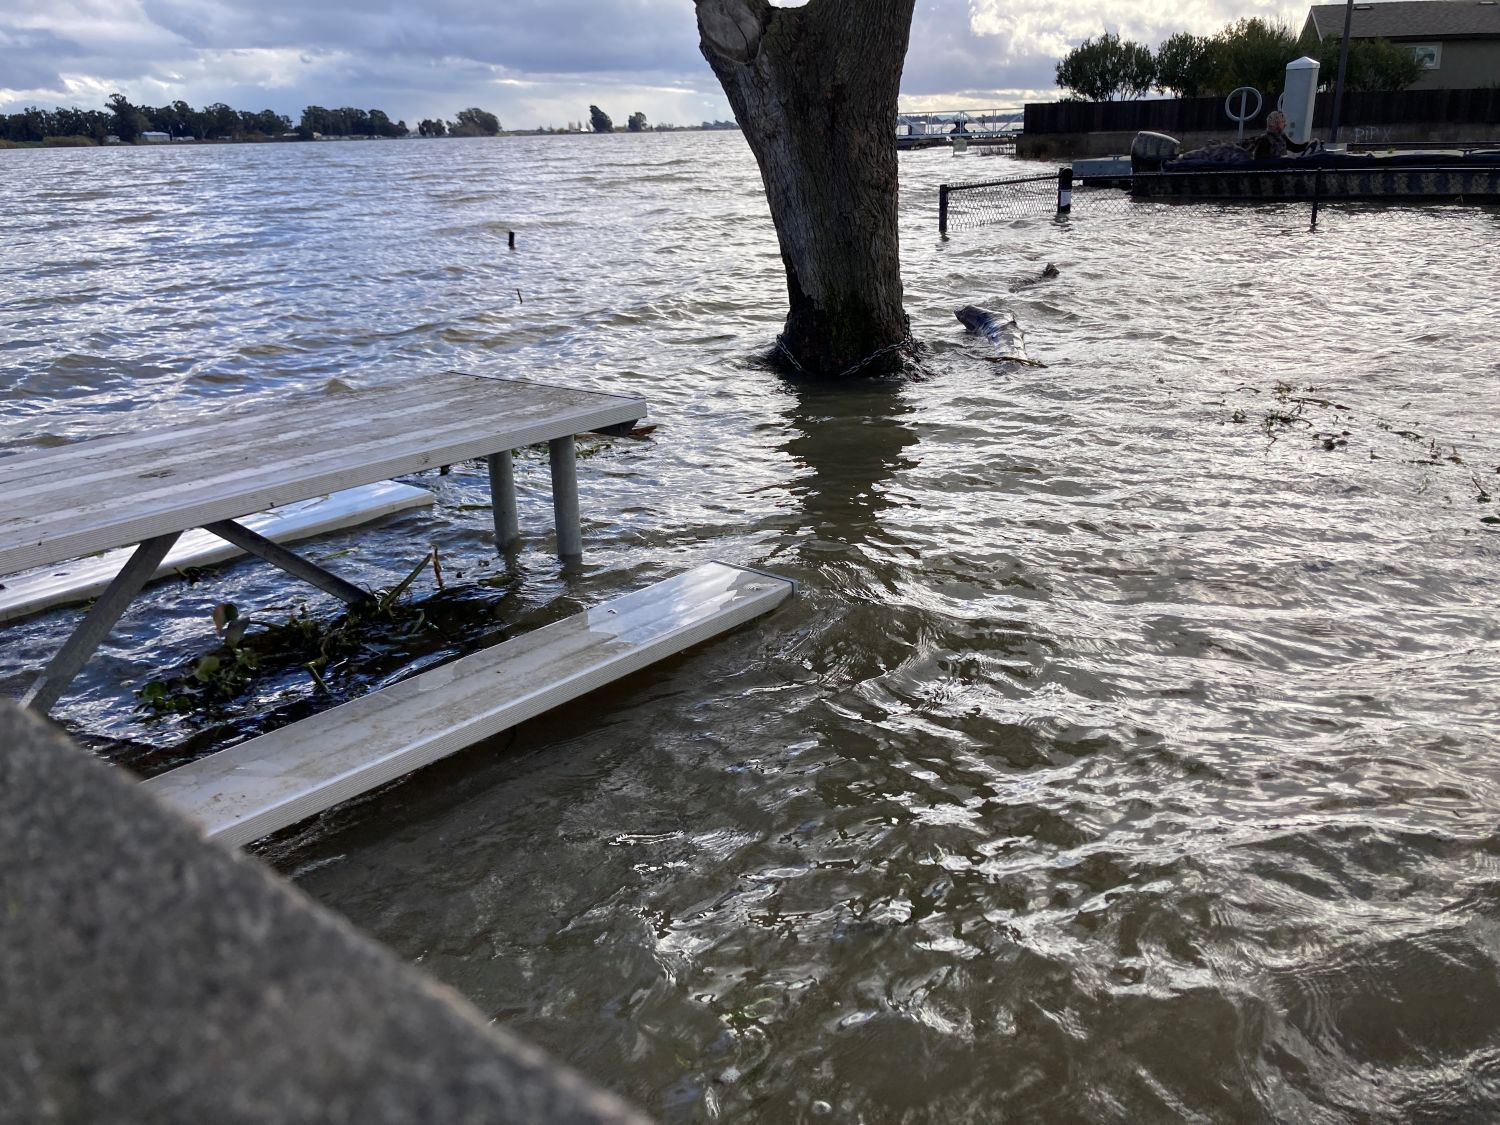
Public Boat Launch, Rio Vista, 1/3/2026
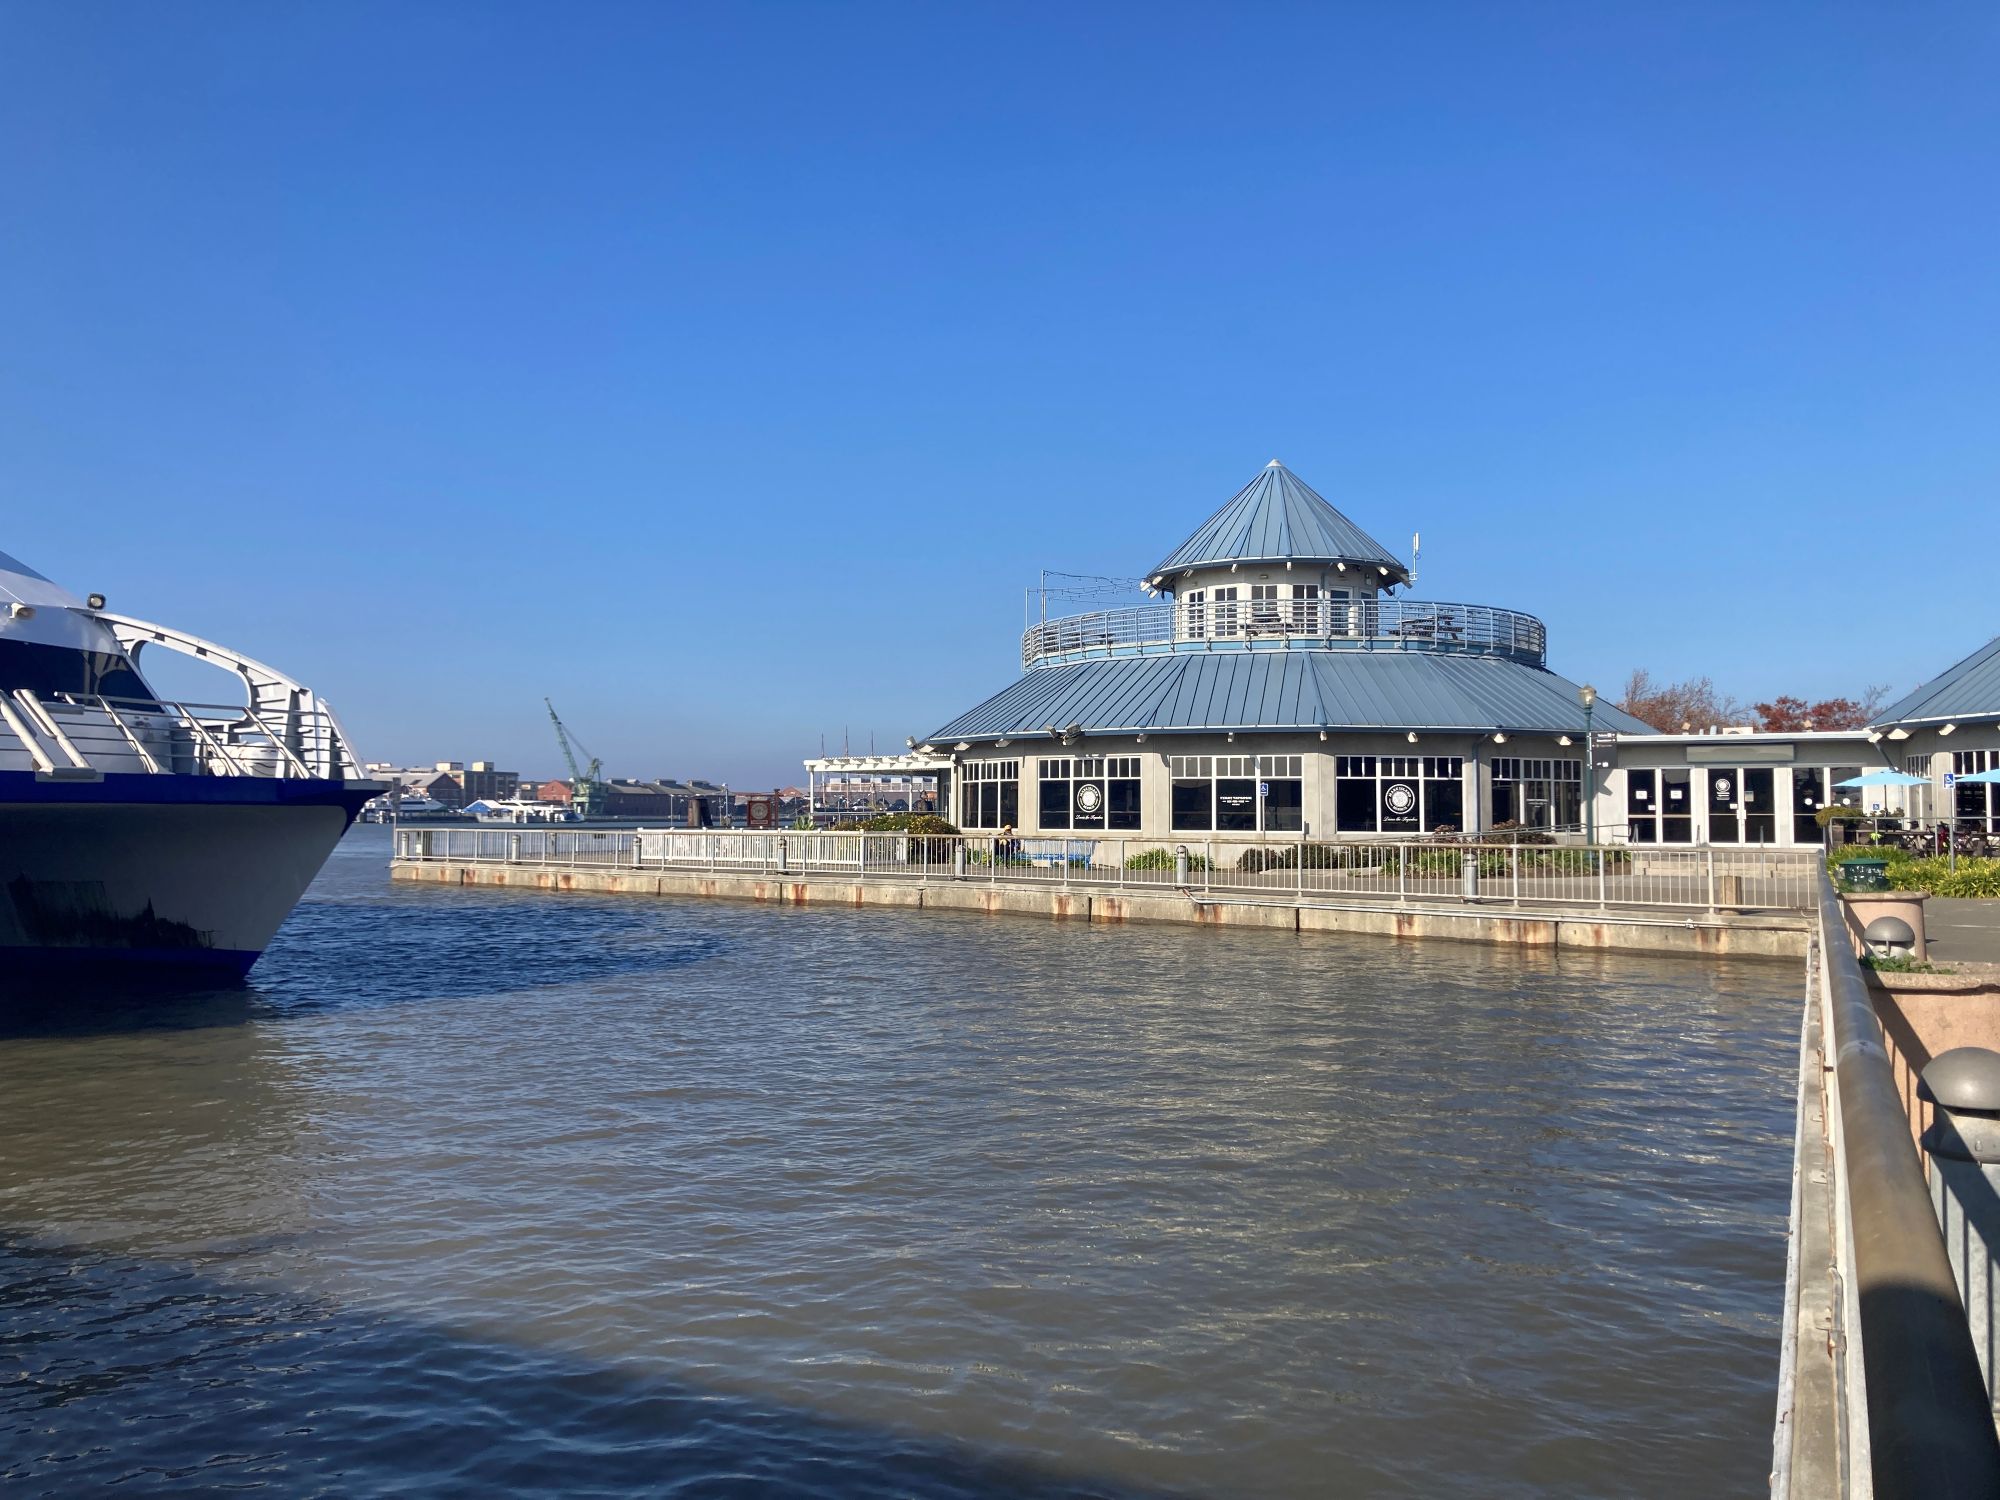
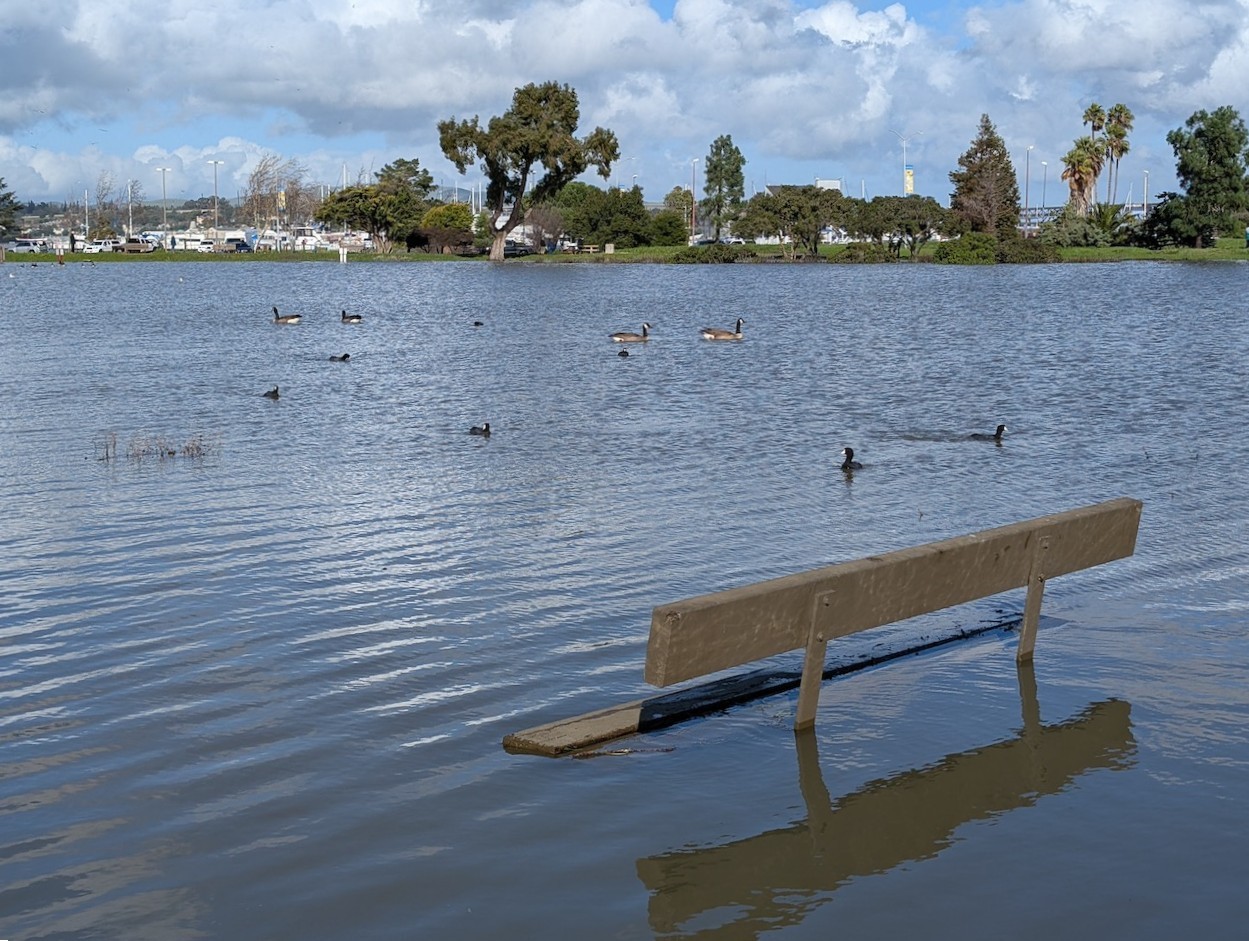
Vallejo Ferry Terminal, 12/4/2025
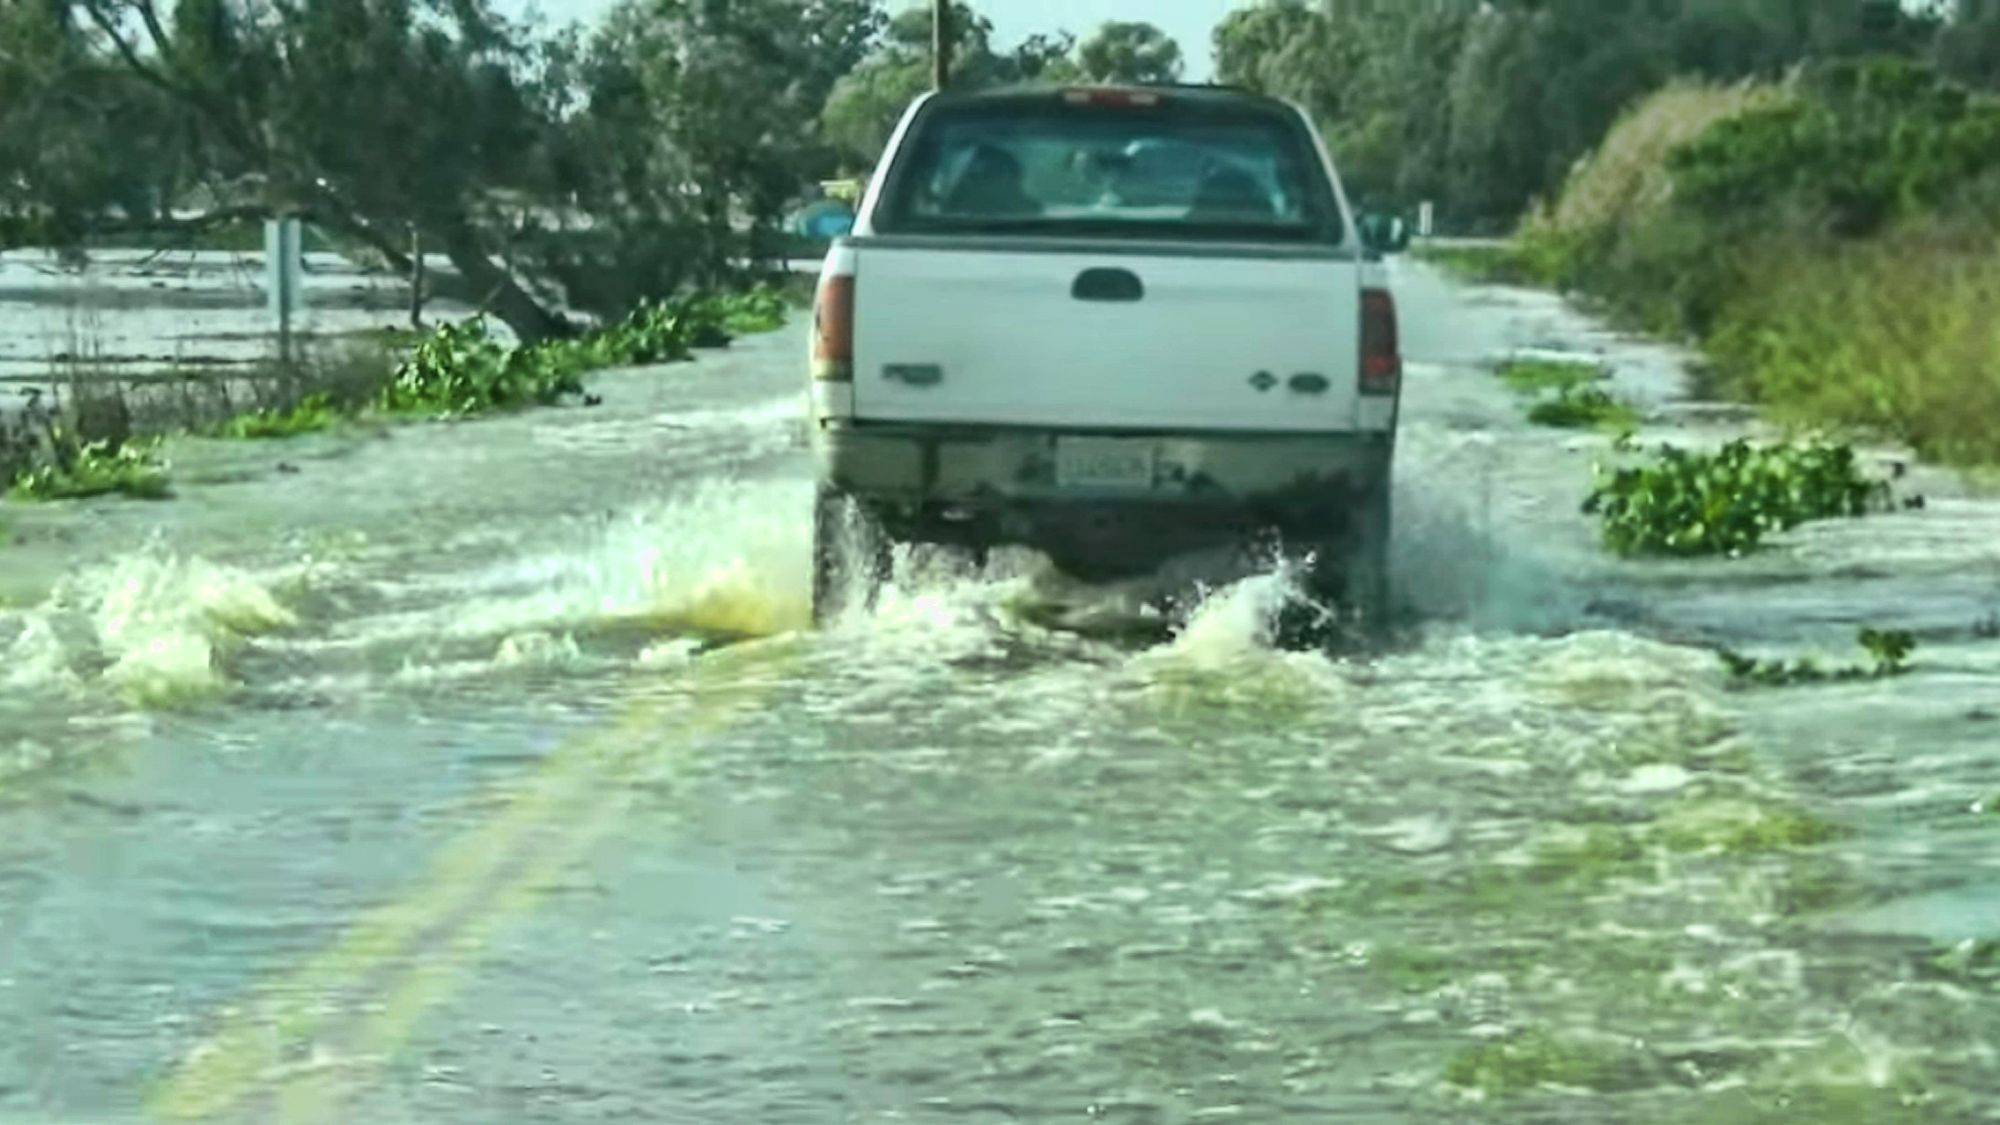
Grizzly Island, Montezuma Slough, 1/3/2026
Yacht basin, Suisun City Harbor, 1/3/2026
City Dock, Rio Vista, 11/15/2024
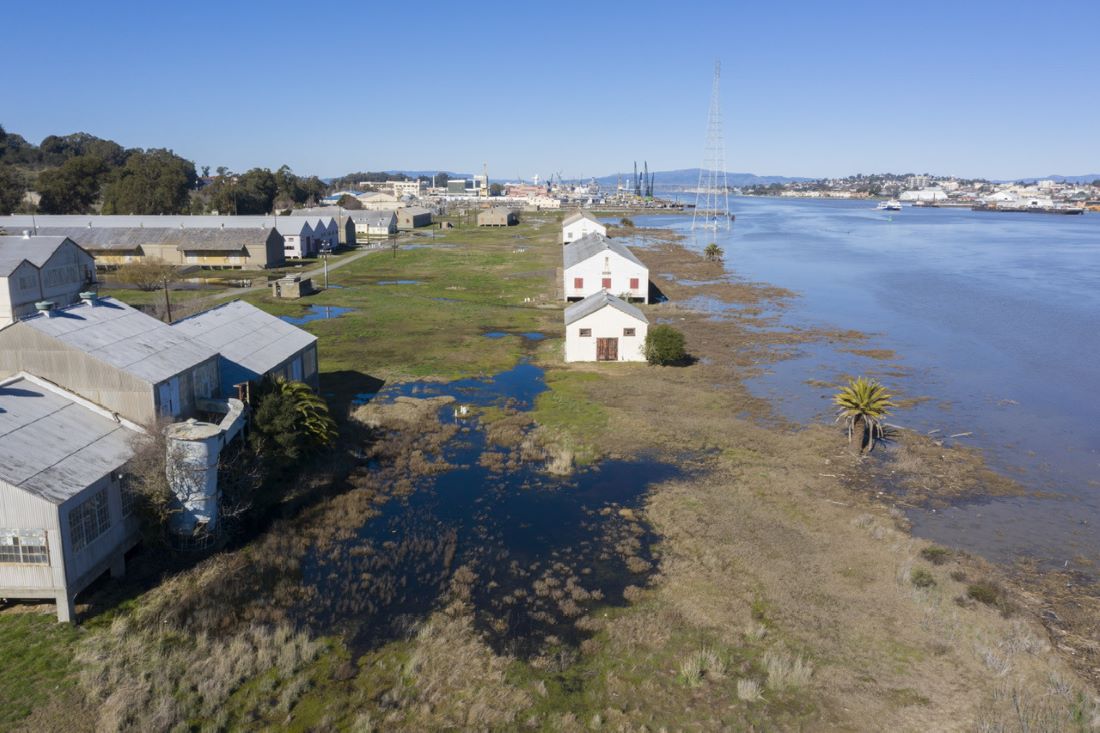
Mare Island, Vallejo, 1/22/2023
Martinez Shoreline, 1/3/2026
Richmond Marina, 1/3/2026
Point Richmond, 1/3/2026
Meeker Slough, Richmond, 1/3/2026
Big Break Regional Shoreline trail, Oakley, 12/14/2024

Harbor Channel, Richmond, 11/20/2024
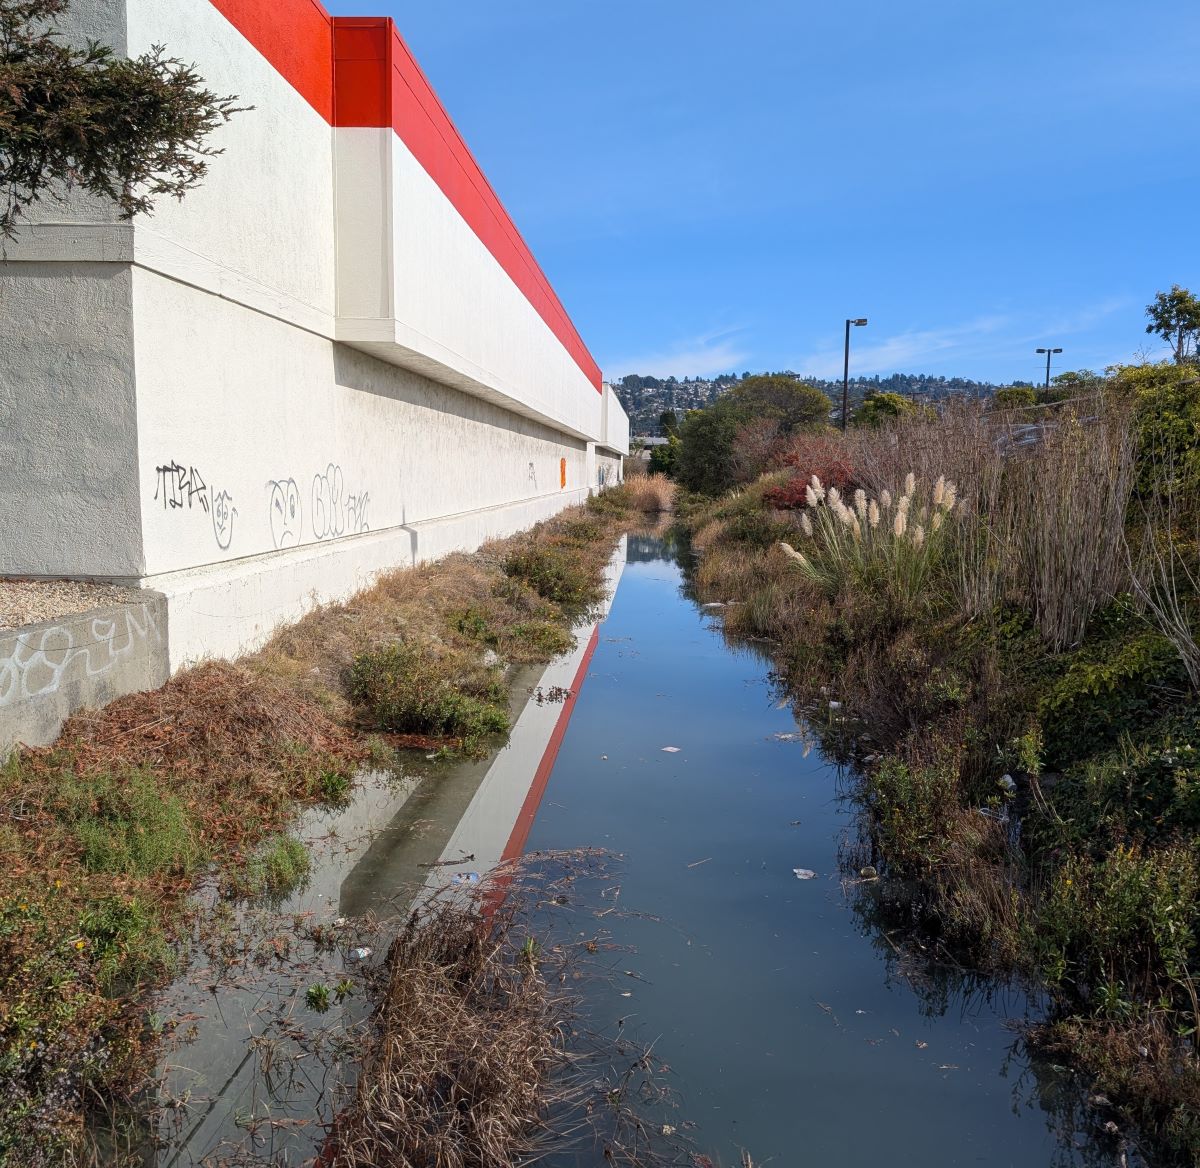
Cerrito Creek at Pacific East Mall, Richmond 11/16/2024
Pinole Creek, Hercules, 12/14/2024
Pittsburg Marina, 1/9/2024
McLeod Lake adjacent to Center Street, Stockton, 11/14/2025
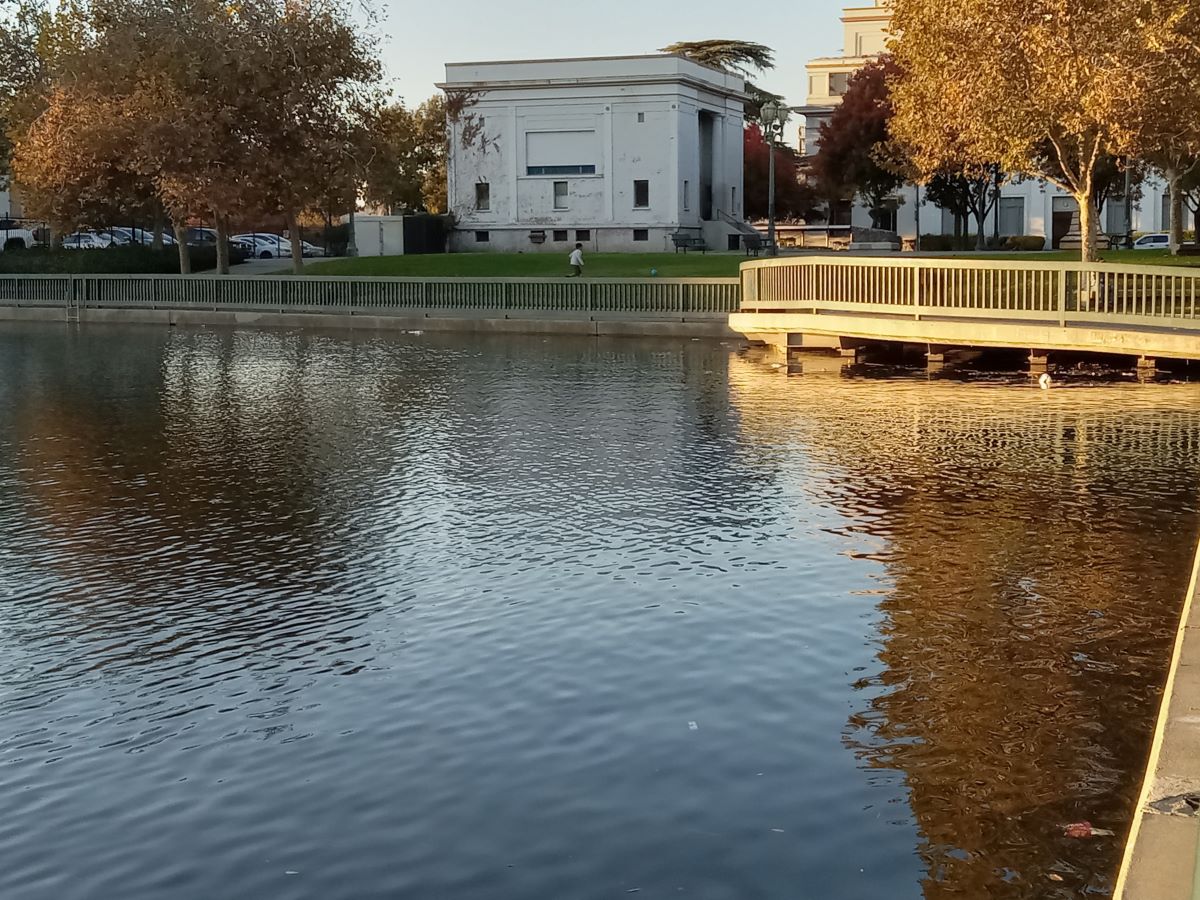
Center Street looking forward W. Weber Avenue, Stockton, 1/11/2024
Virginia Street Extension, Berkeley, 1/3/2026
Behind Harbor Bay Club, Alameda, 1/2/2026
Embarcadero, Oakland, 1/2/2026
South Shore Beach, Alameda, 1/3/2026
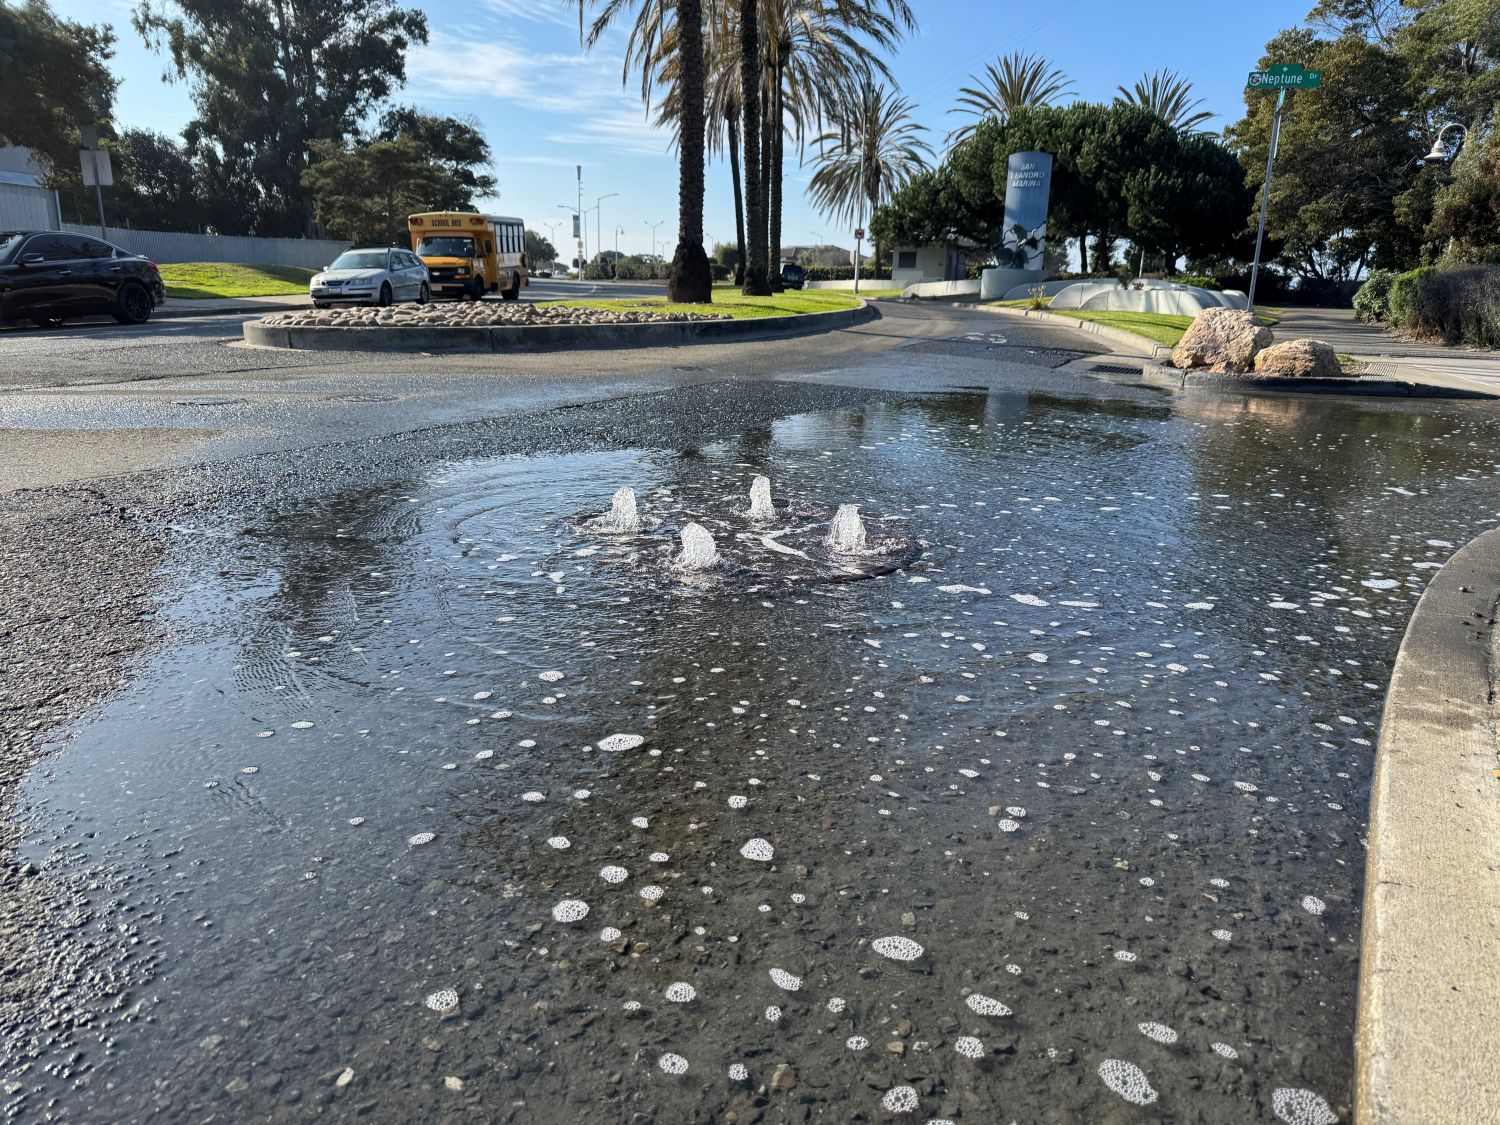
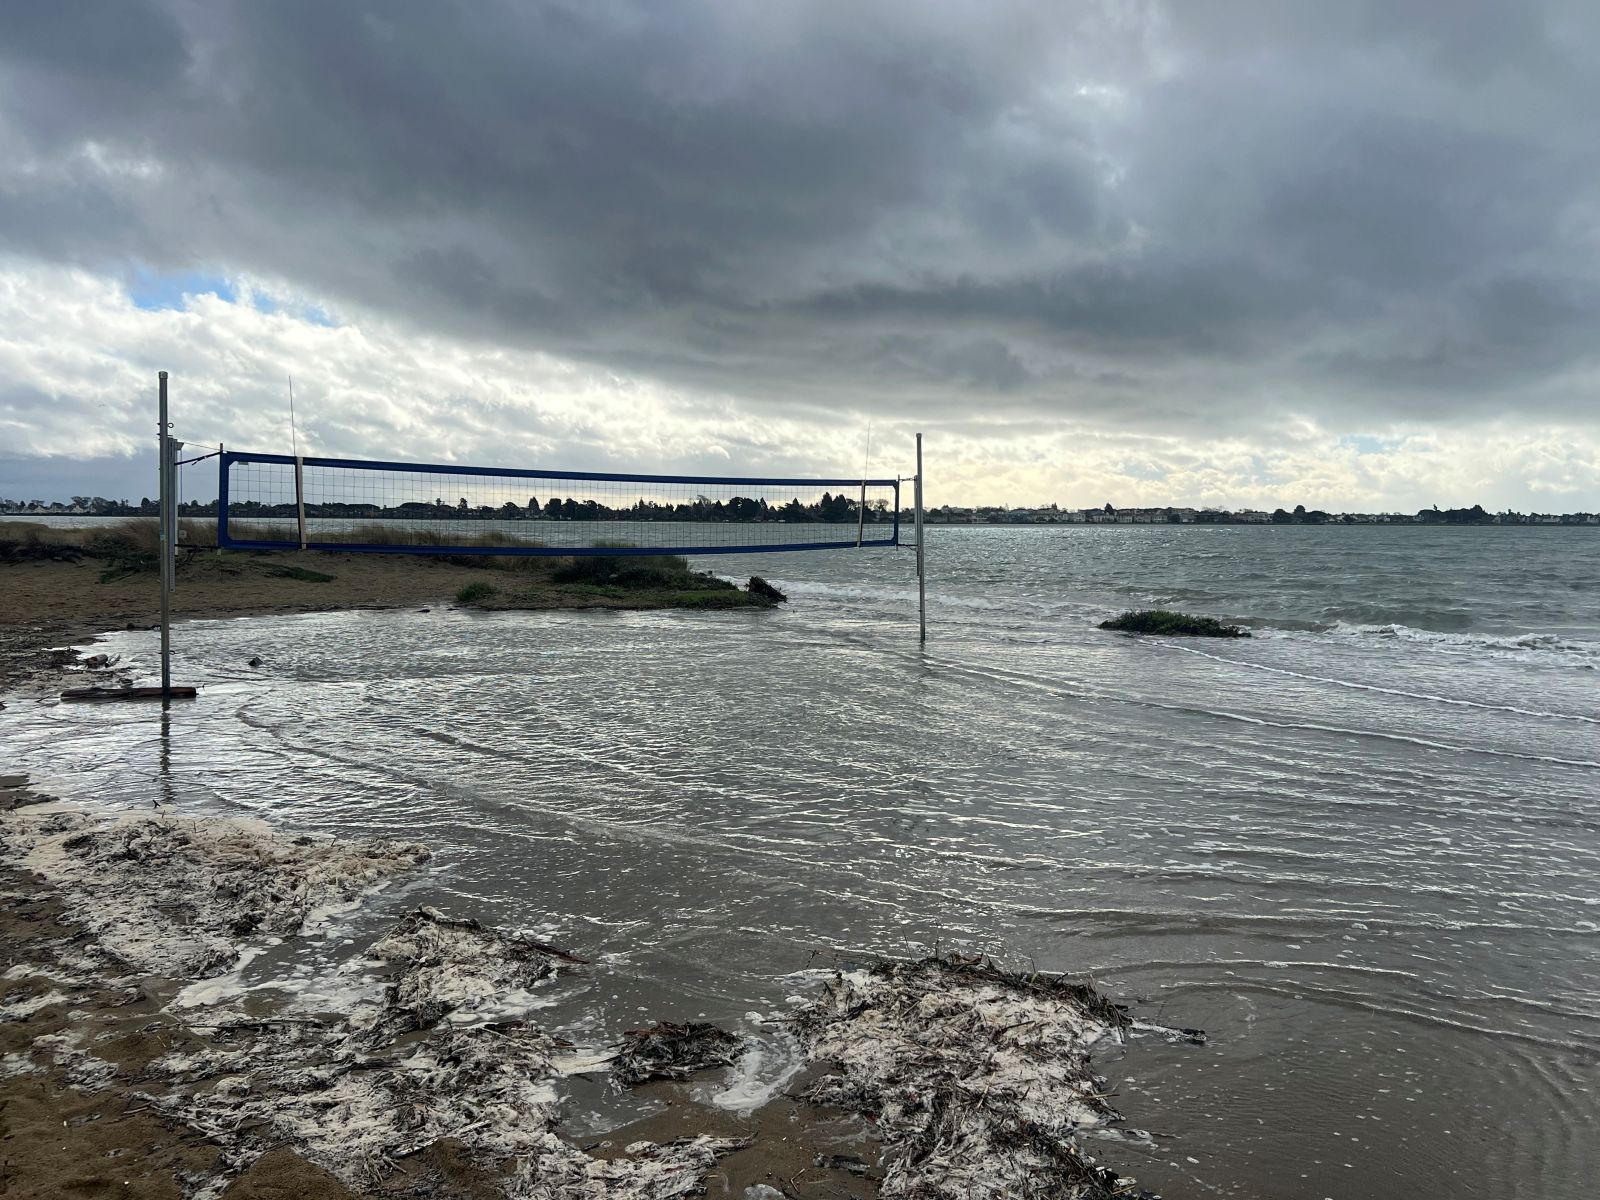
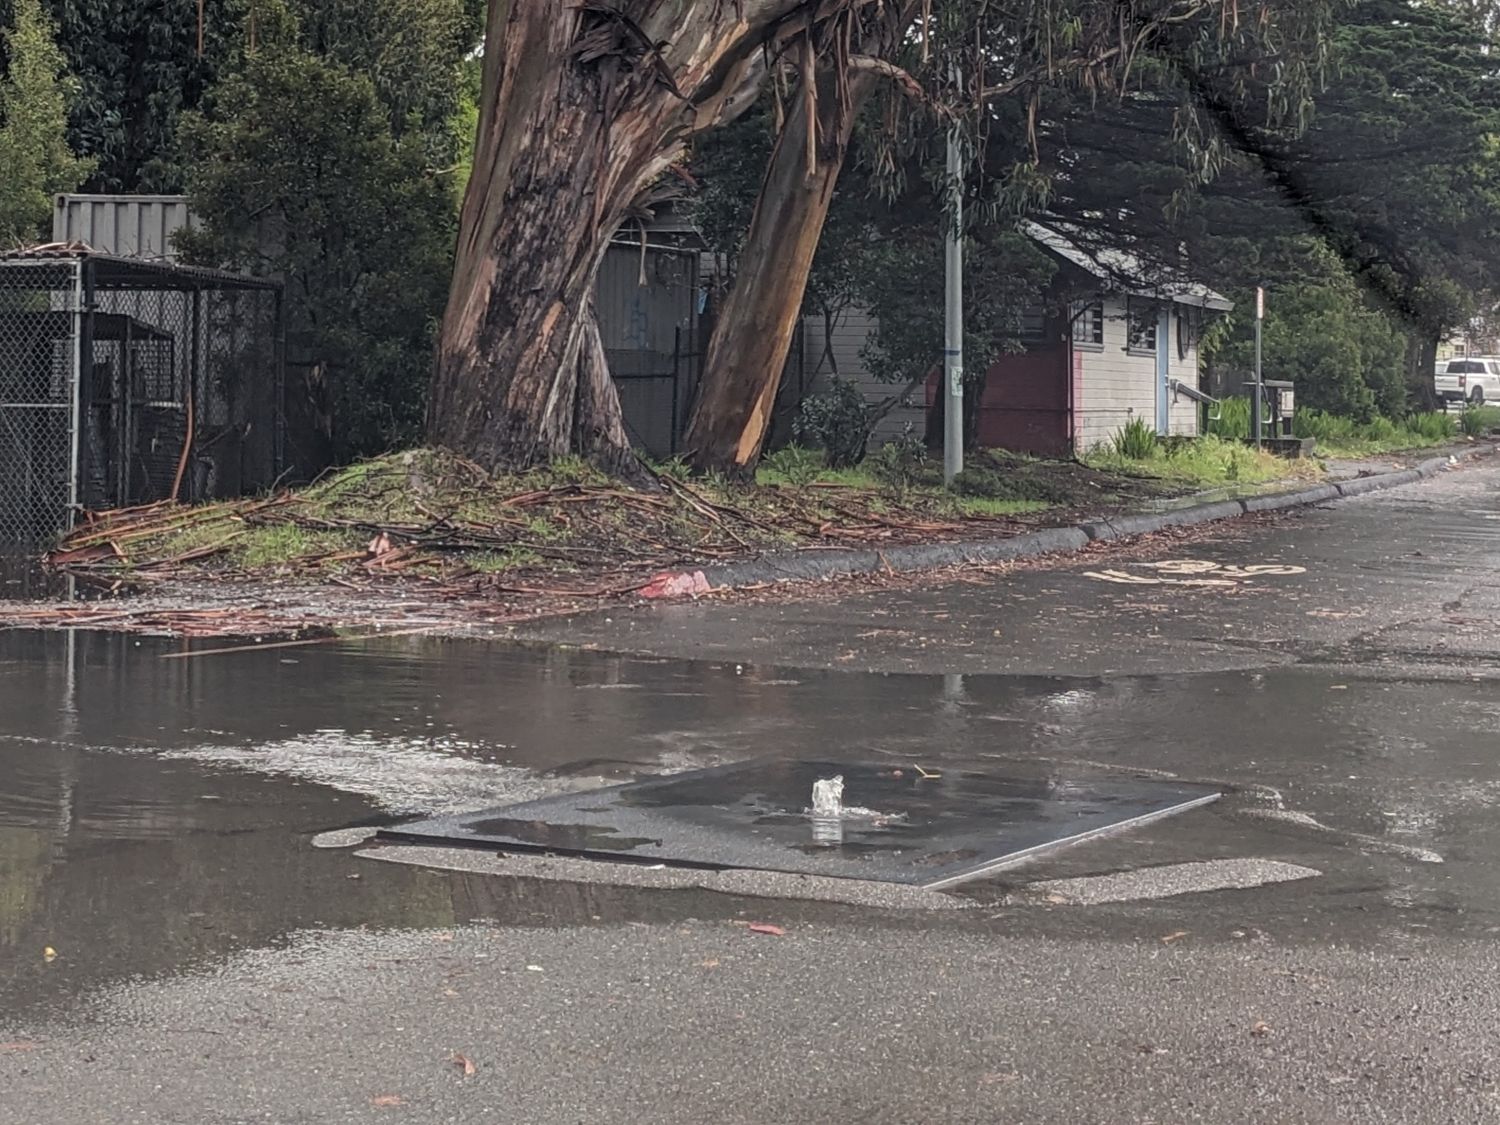
Monarch Bay Drive, San Leandro, 12/4/2025
Aquatic Park, Berkeley, 1/4/2026
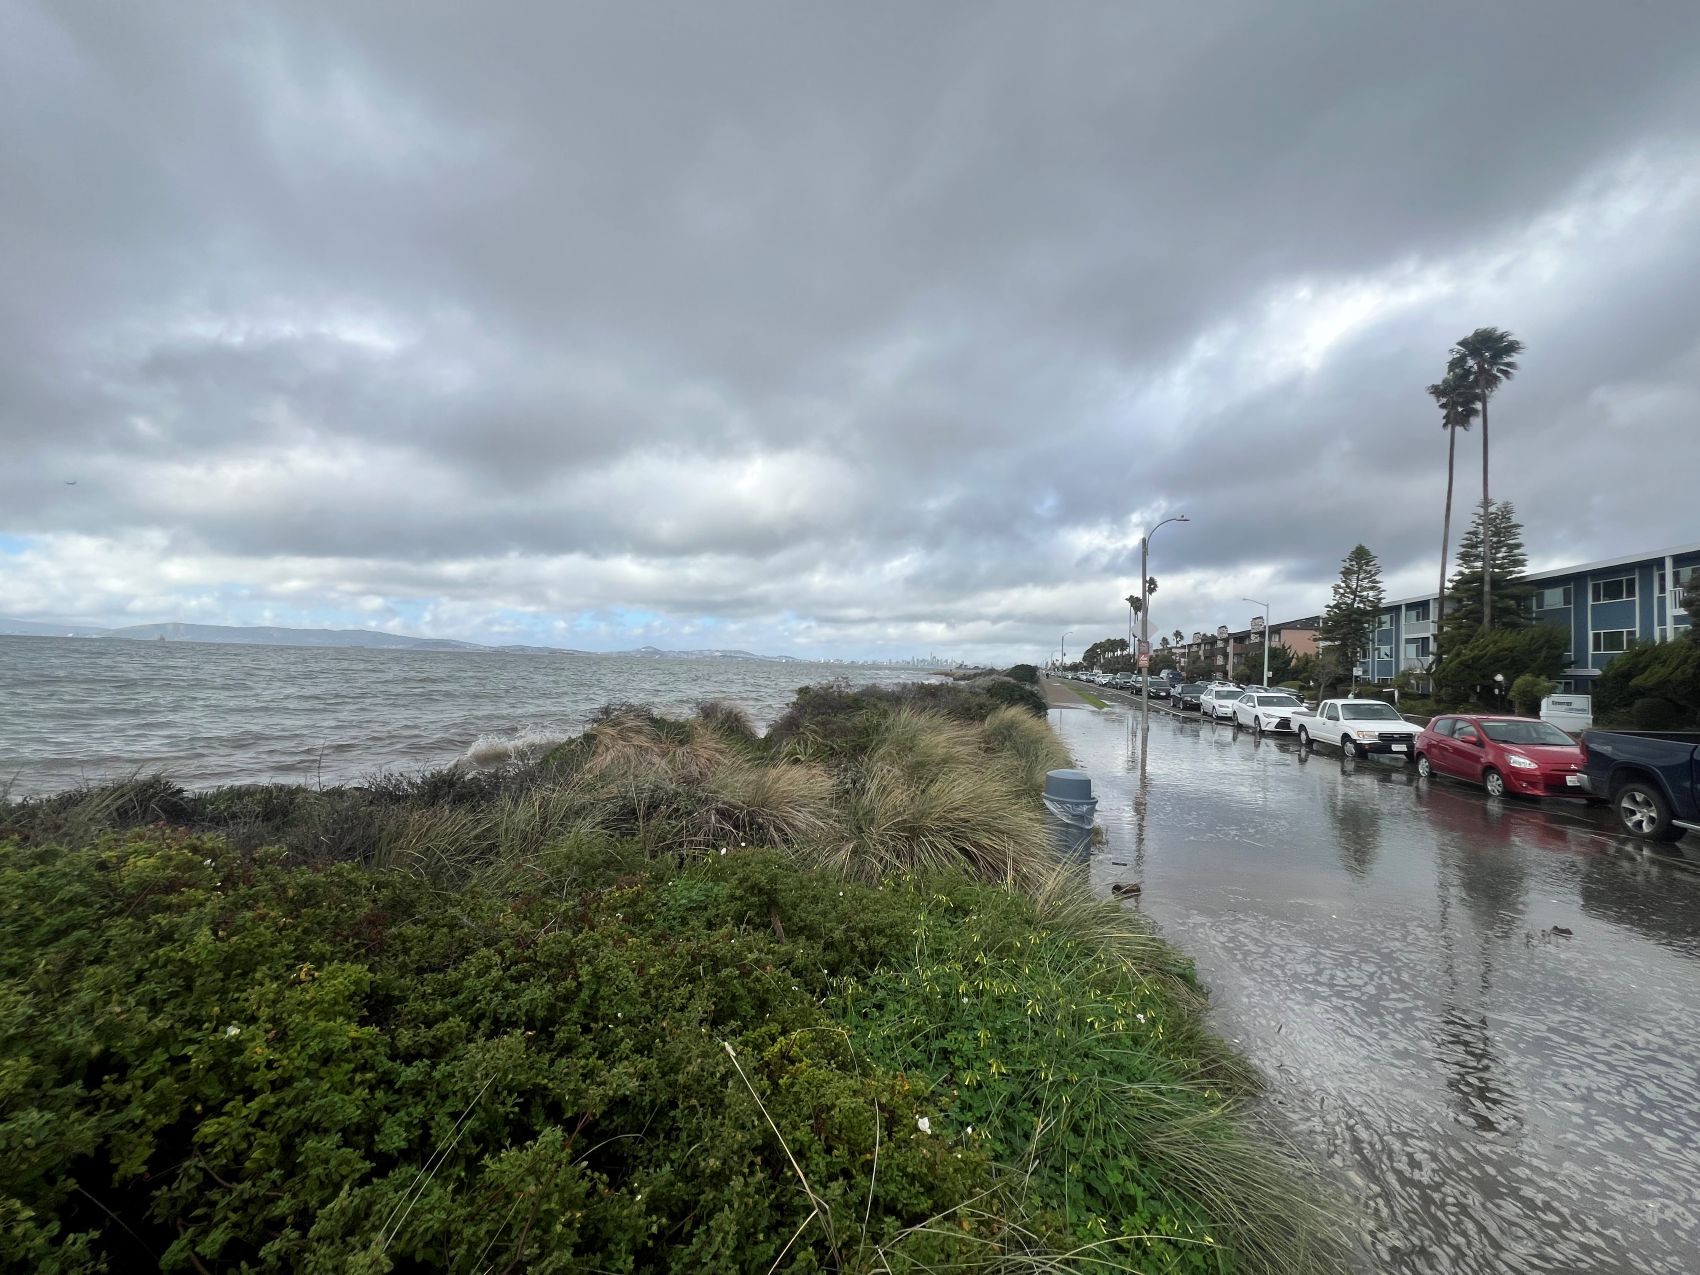
Shoreline Drive, Alameda, 1/3/2026
Bay Trail south of Albany Beach, 1/3/2026

Veterans Court, Bay Farm Island, Alameda, 12/14/2024
Marshlands Road, Fremont, 12/14/2024
Oakland Ferry Terminal, 11/16/2024
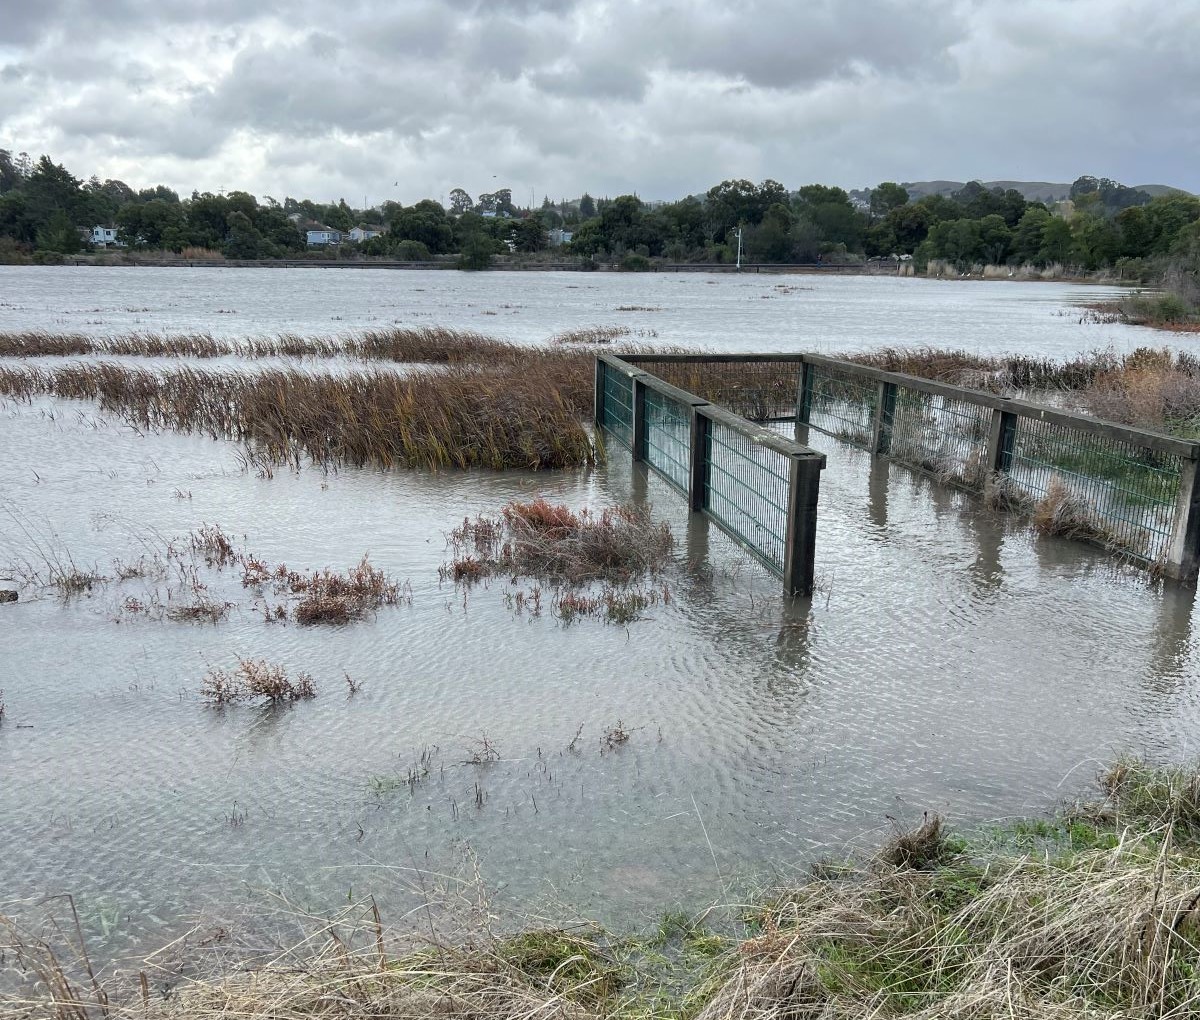
Hayward Shoreline Interpretive Center, Hayward, 1/21/2023
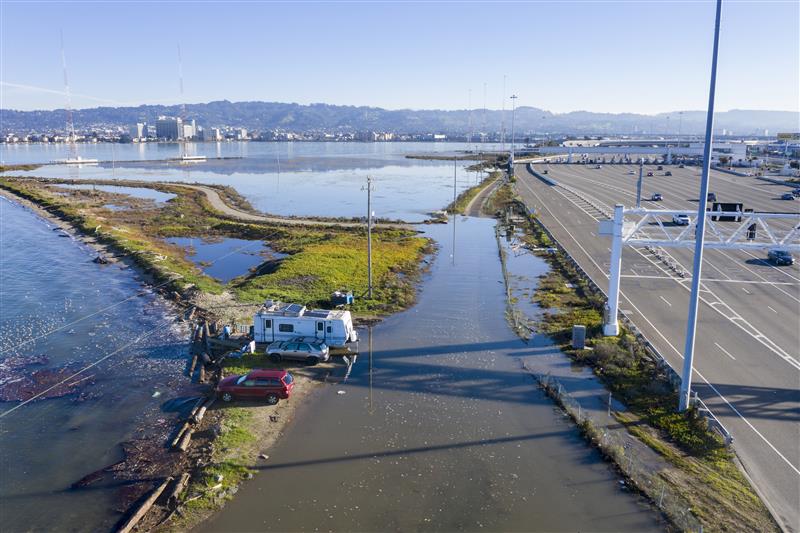
Bay Bridge Toll Plaza Beach, Oakland, 1/2/2022
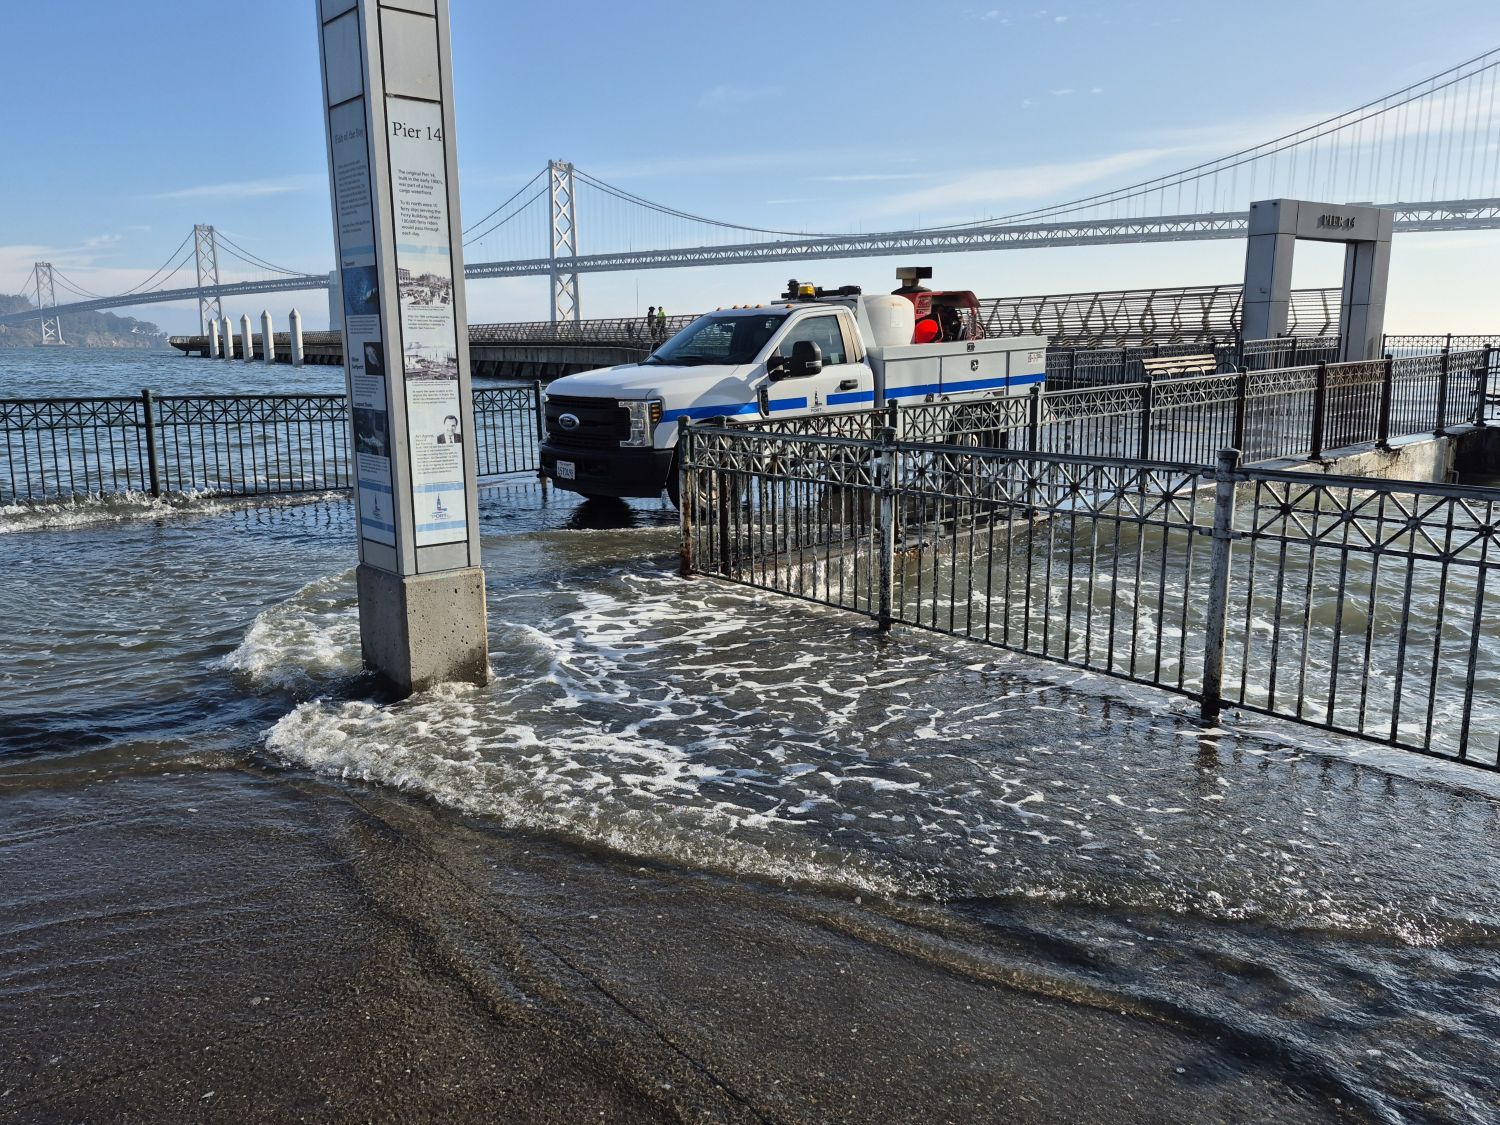
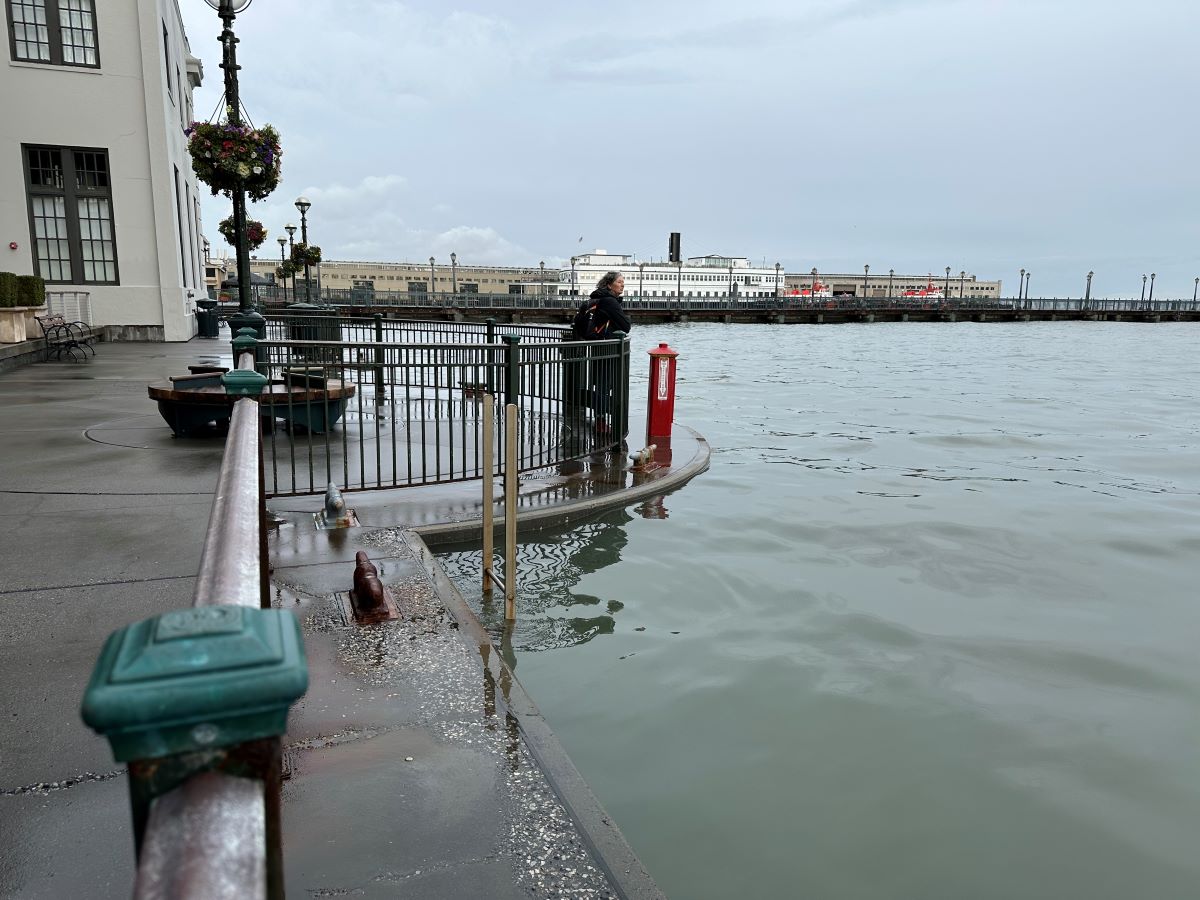
Pier 14, San Francisco, 12/4/2025
Marina Green, San Francisco, 12/4/2025
Embarcadero from Ferry Gate G, San Francisco, 12/13/2024
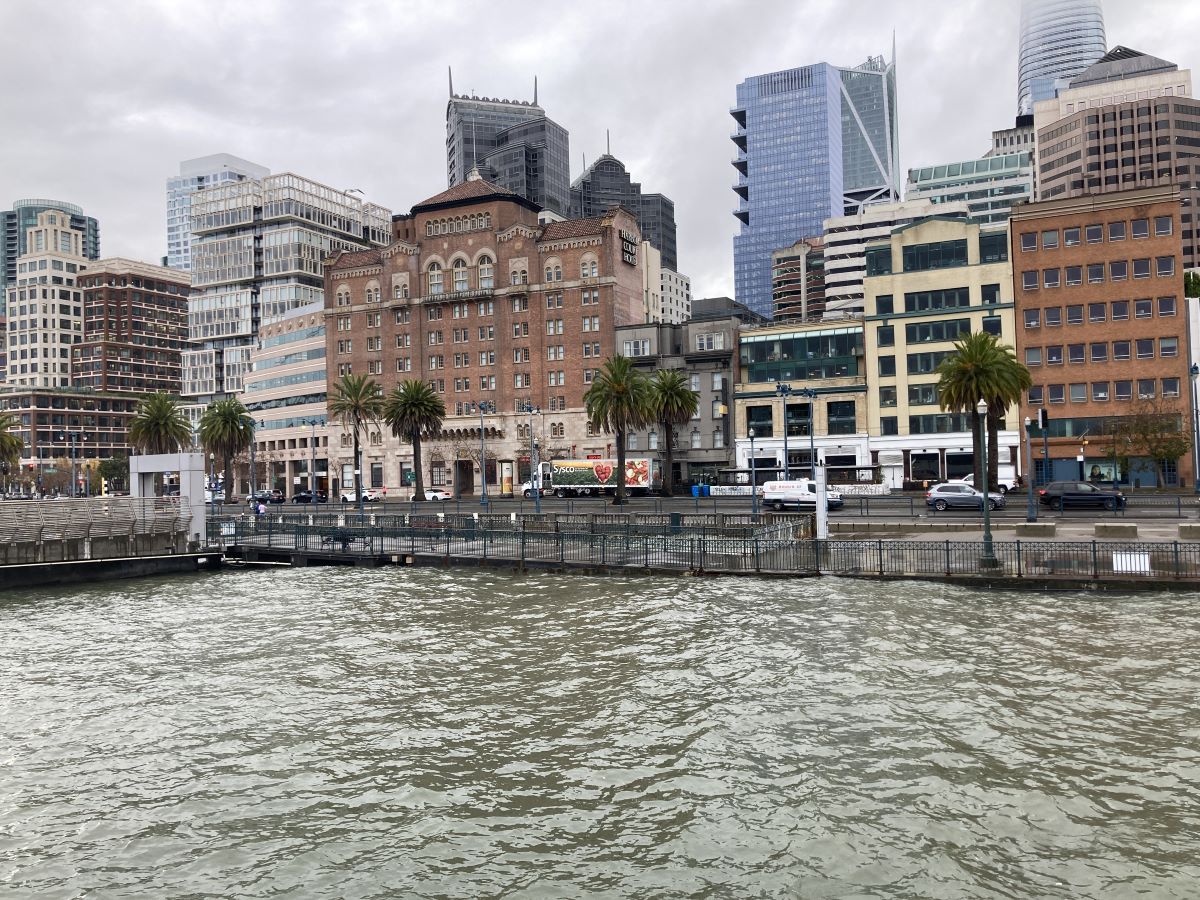
Pier 5, San Francisco, 12/13/2024
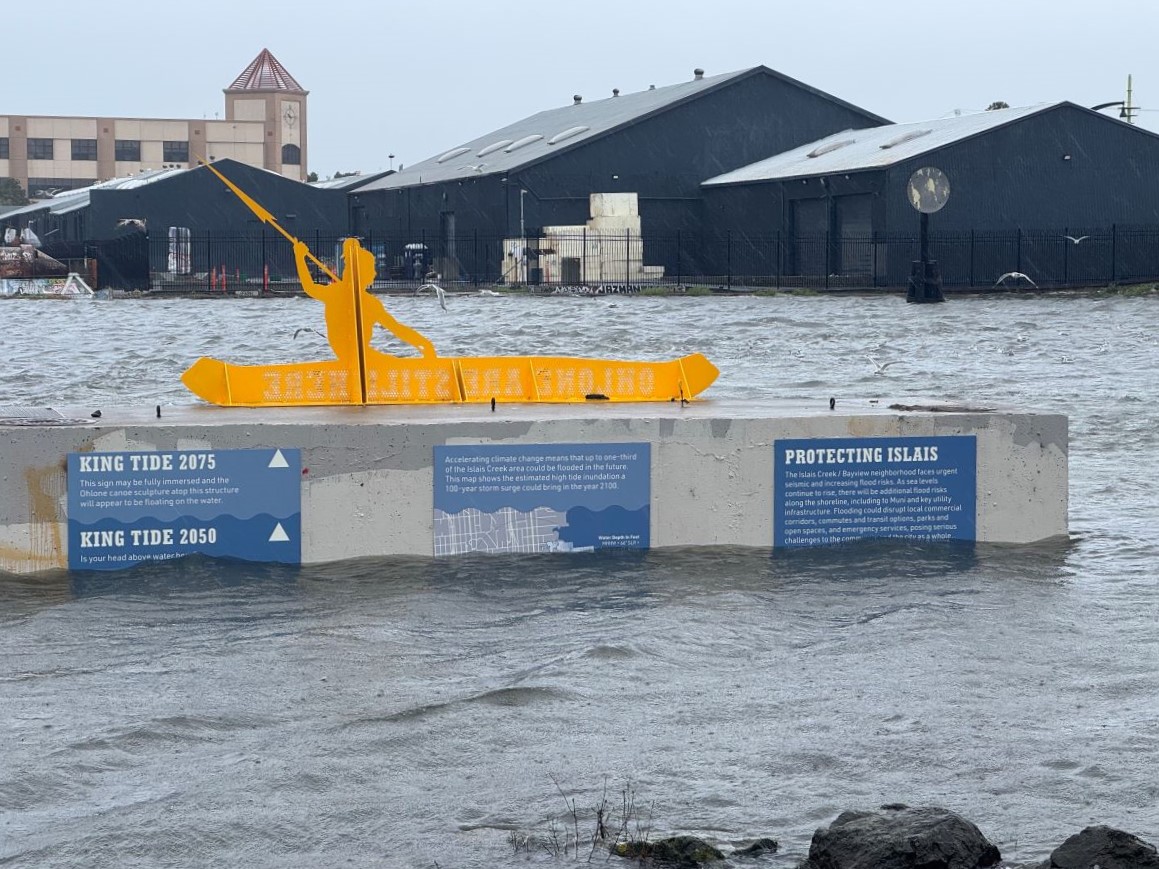
Islais Creek Landing, San Francisco, 12/14/2024

Sutro Baths, San Francisco, 11/15/2024
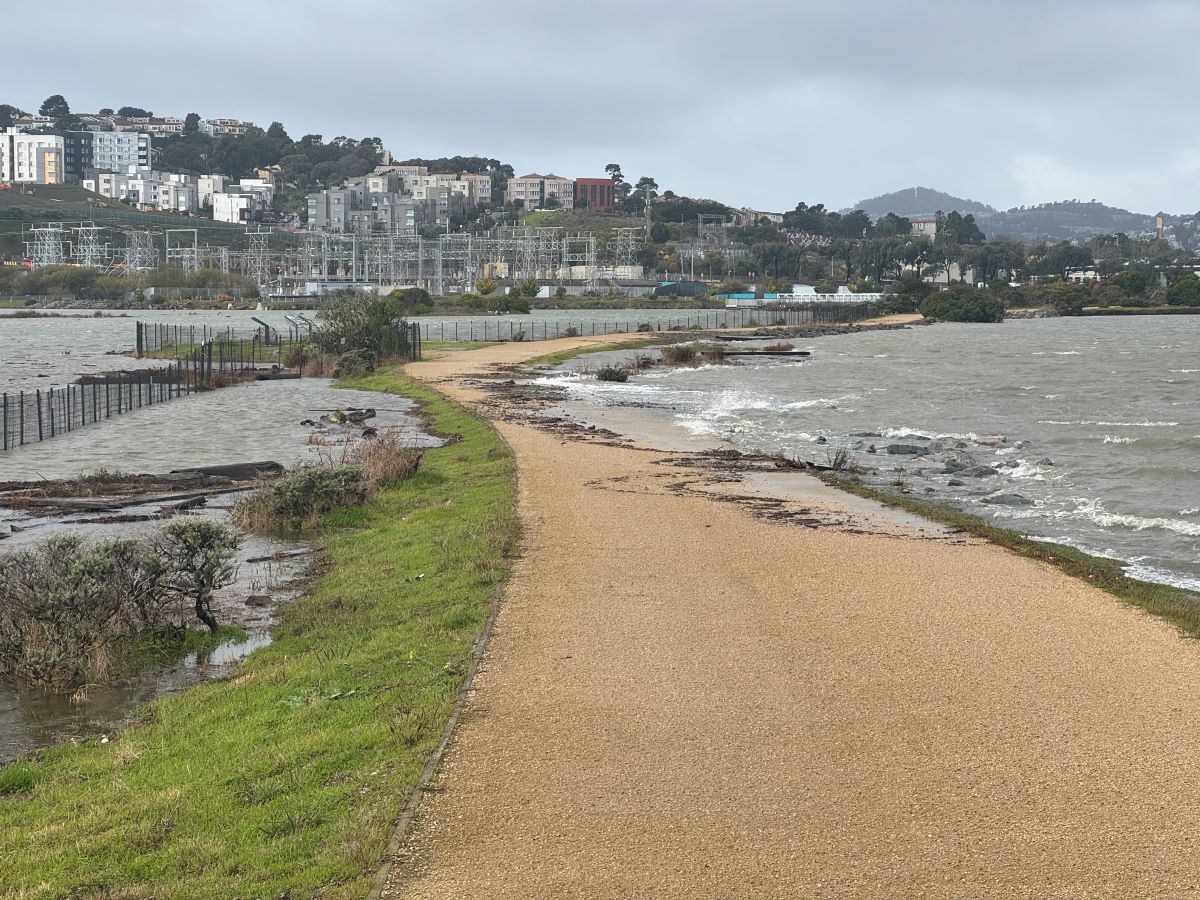
Herons Head Park, San Francisco, 12/14/2024
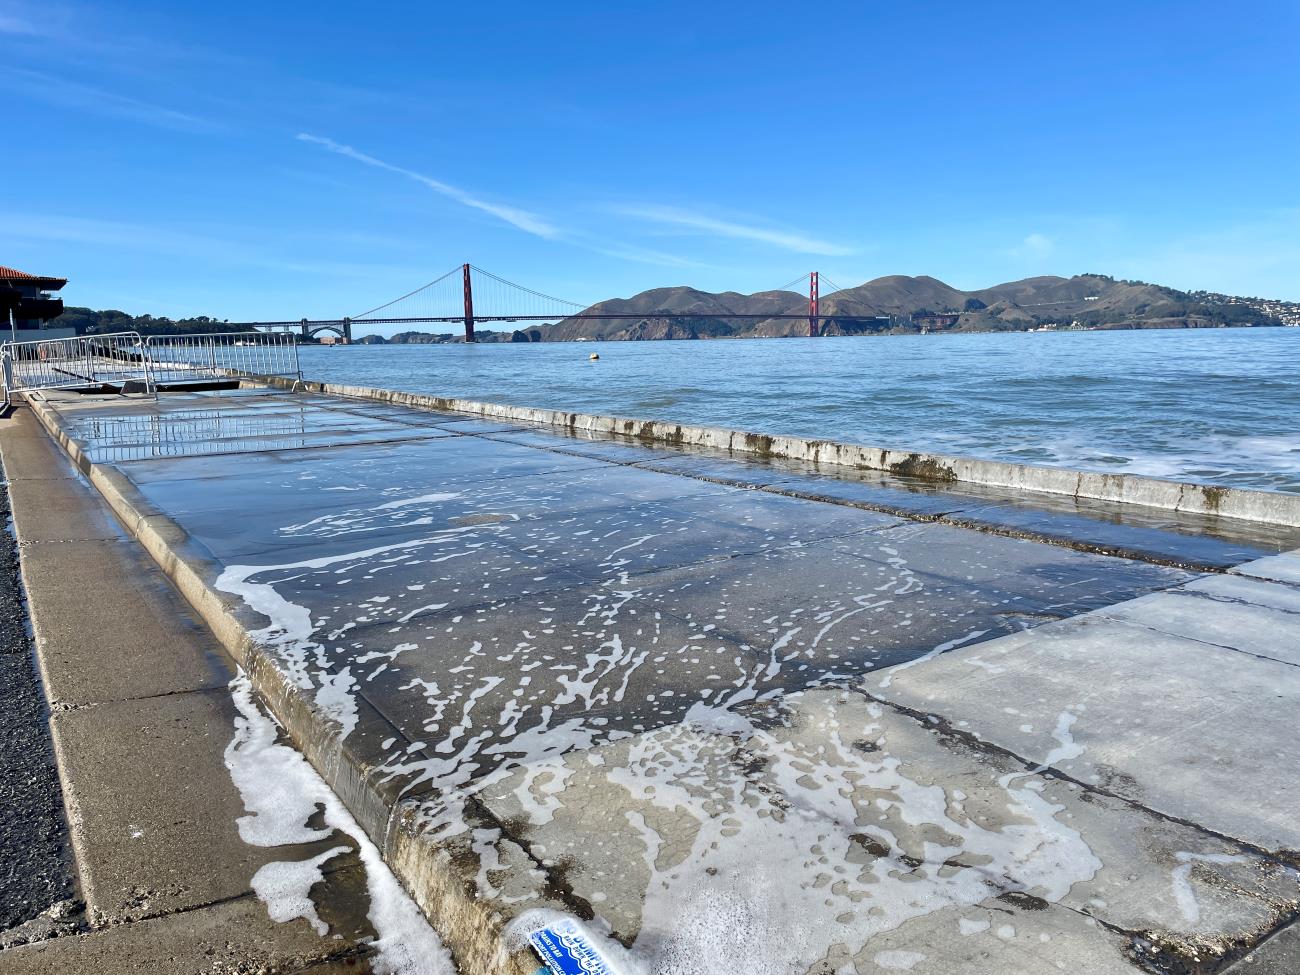
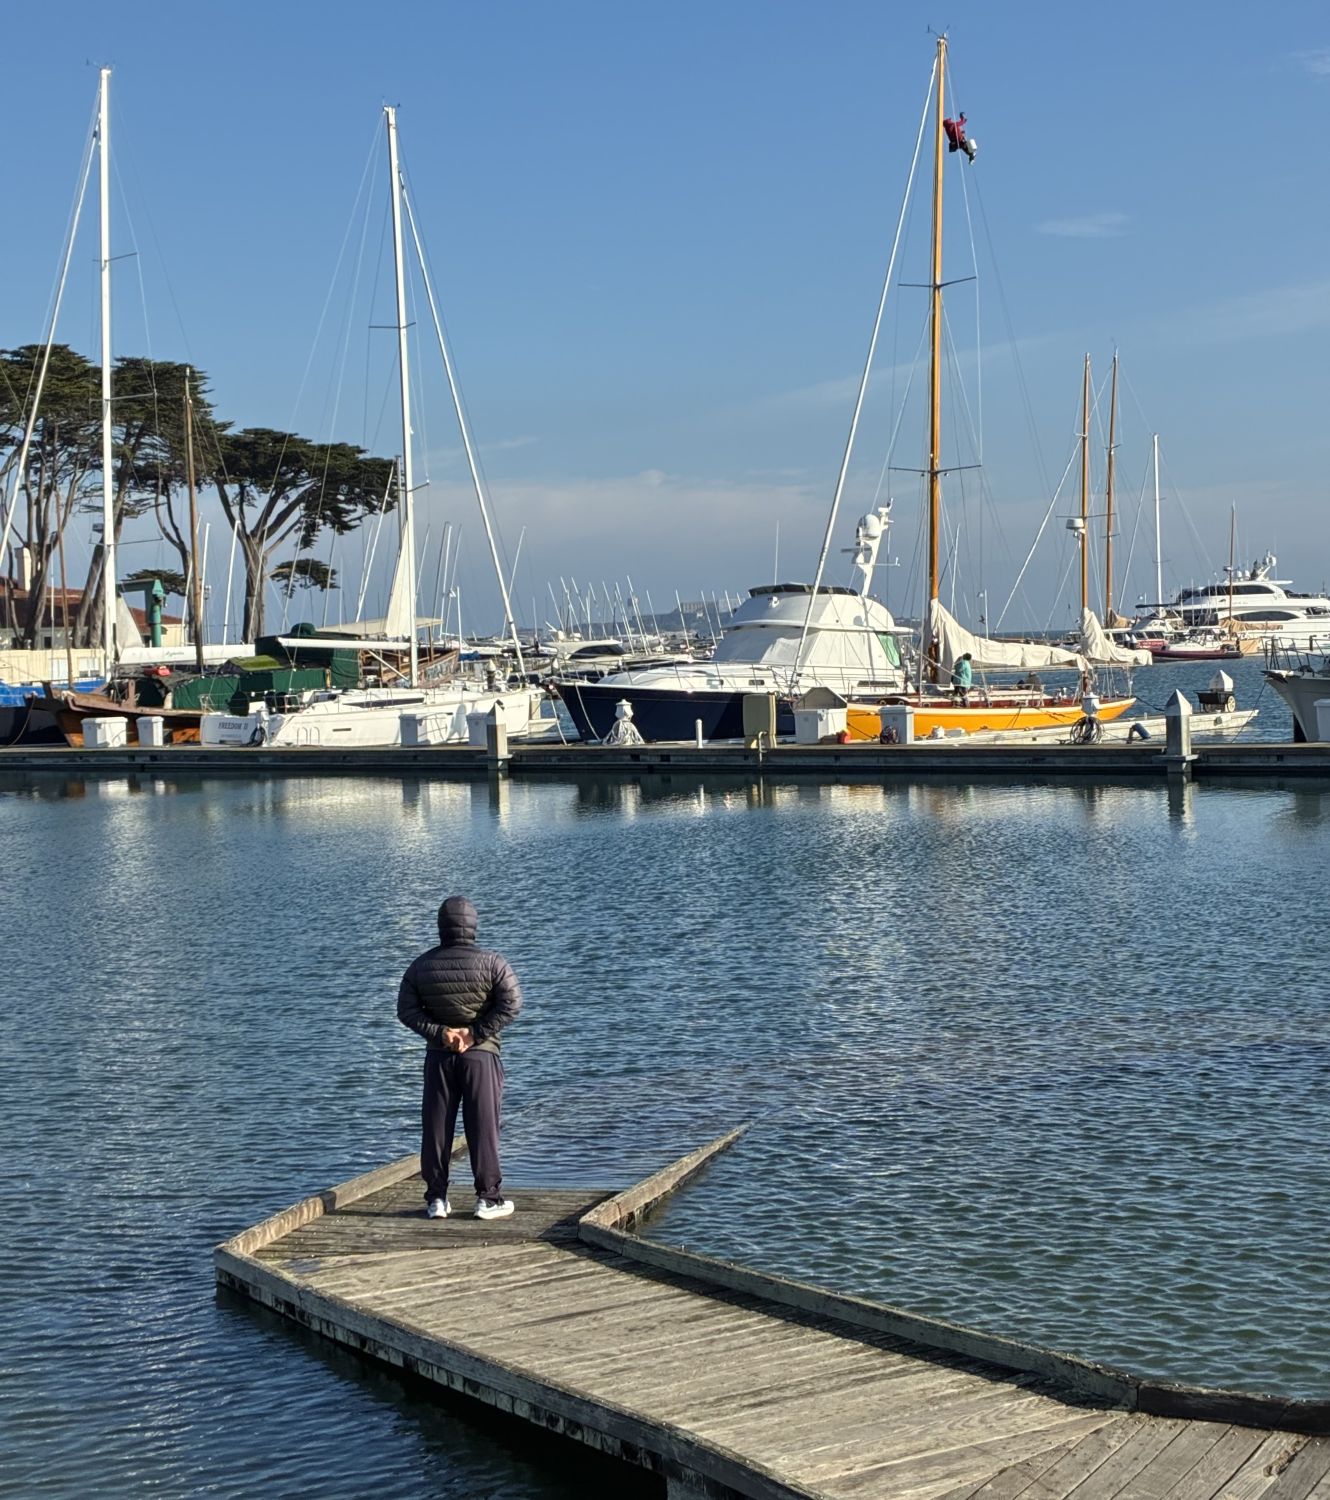
Near St. Francis Yacht Club, San Francisco, 1/11/2024
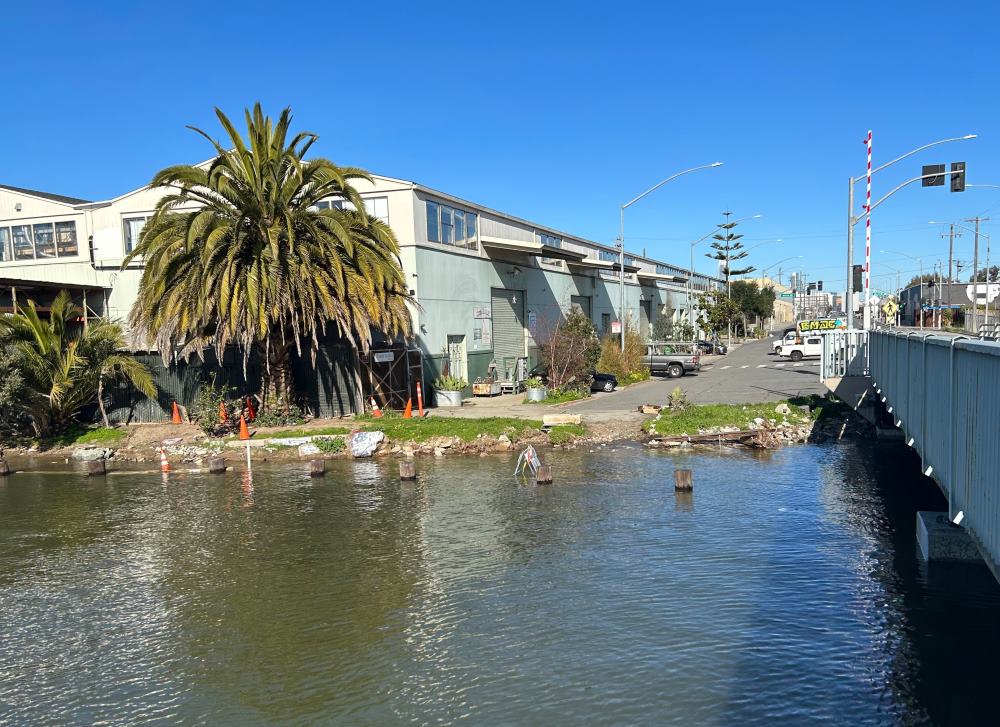
Illinois street at Islais Creek, San Francisco, 1/22/2023
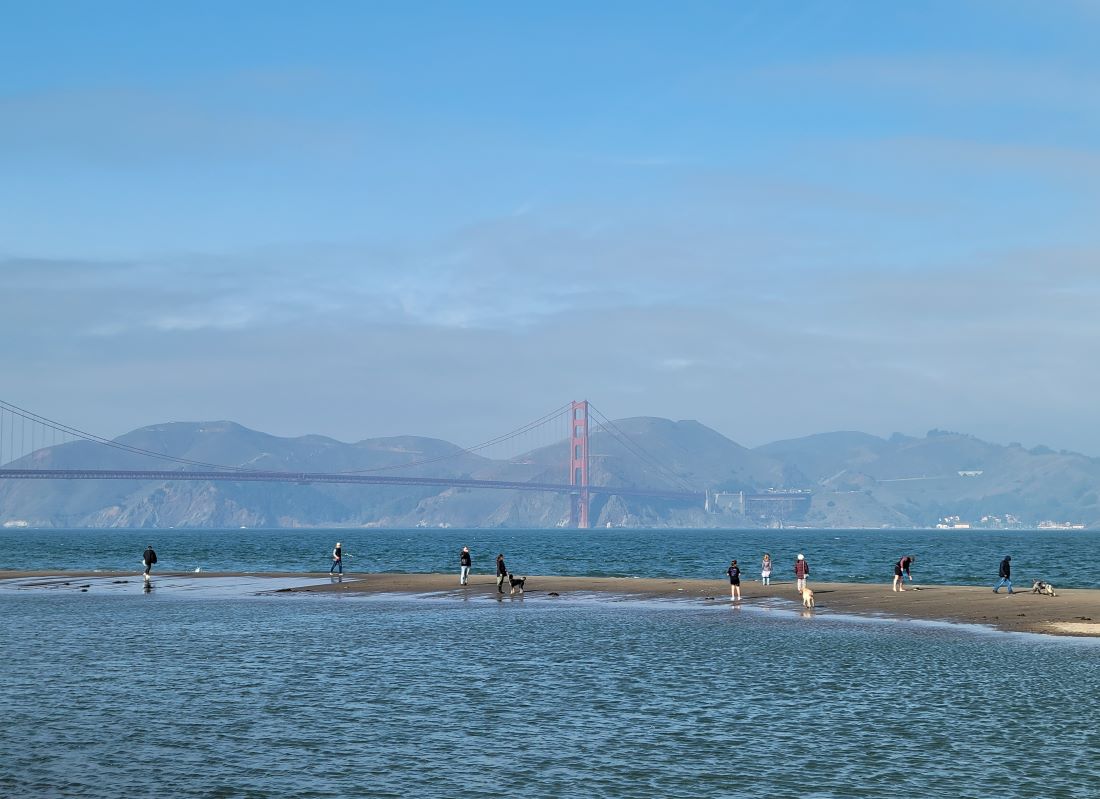
Crissy Field South Beach, San Francisco, 12/23/2022
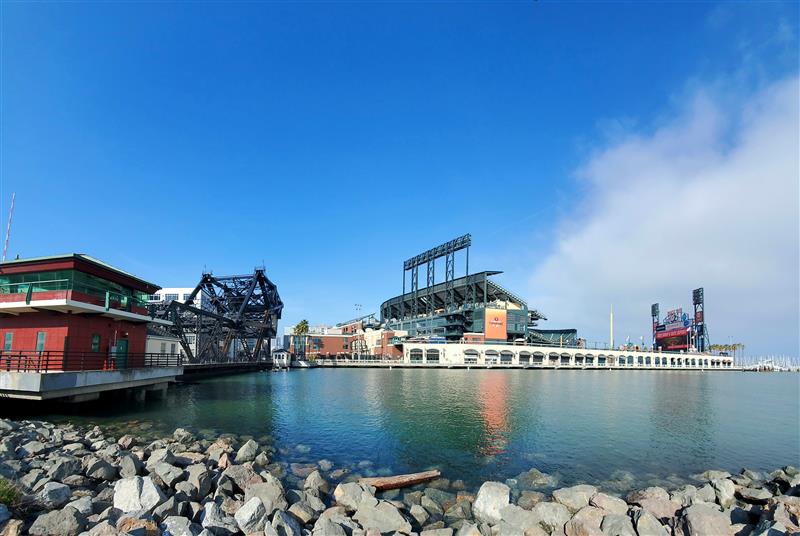
China Basin Park and Oracle Park, San Francisco, 12/5/2021
Alviso Marina, Alviso, 12/5/2025
Palo Alto Baylands, 12/14/2024
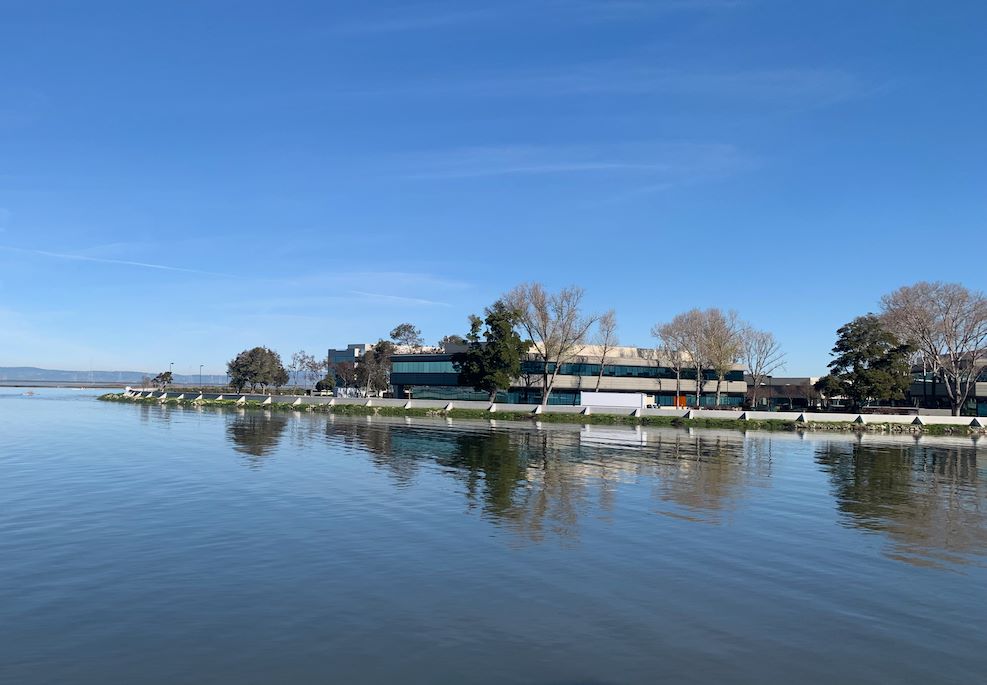
EcoCenter, Palo Alto, 12/14/2024
Lucy Evans Nature Center, Palo Alto, 12/14/2024
Sharp Park, Pacifica, 11/6/2025
Near Redwood Water Sports, Redwood City, 1/3/2026
Oyster Point Marina, South San Francisco, 1/2/2026
Belmont Slough, Foster City, 1/2/2026
Docktown community, Redwood City, 12/5/2025
Pillar Point, 11/6/2025
Ravenswood Salt Pond SF2, Menlo Park, 12/4/2025
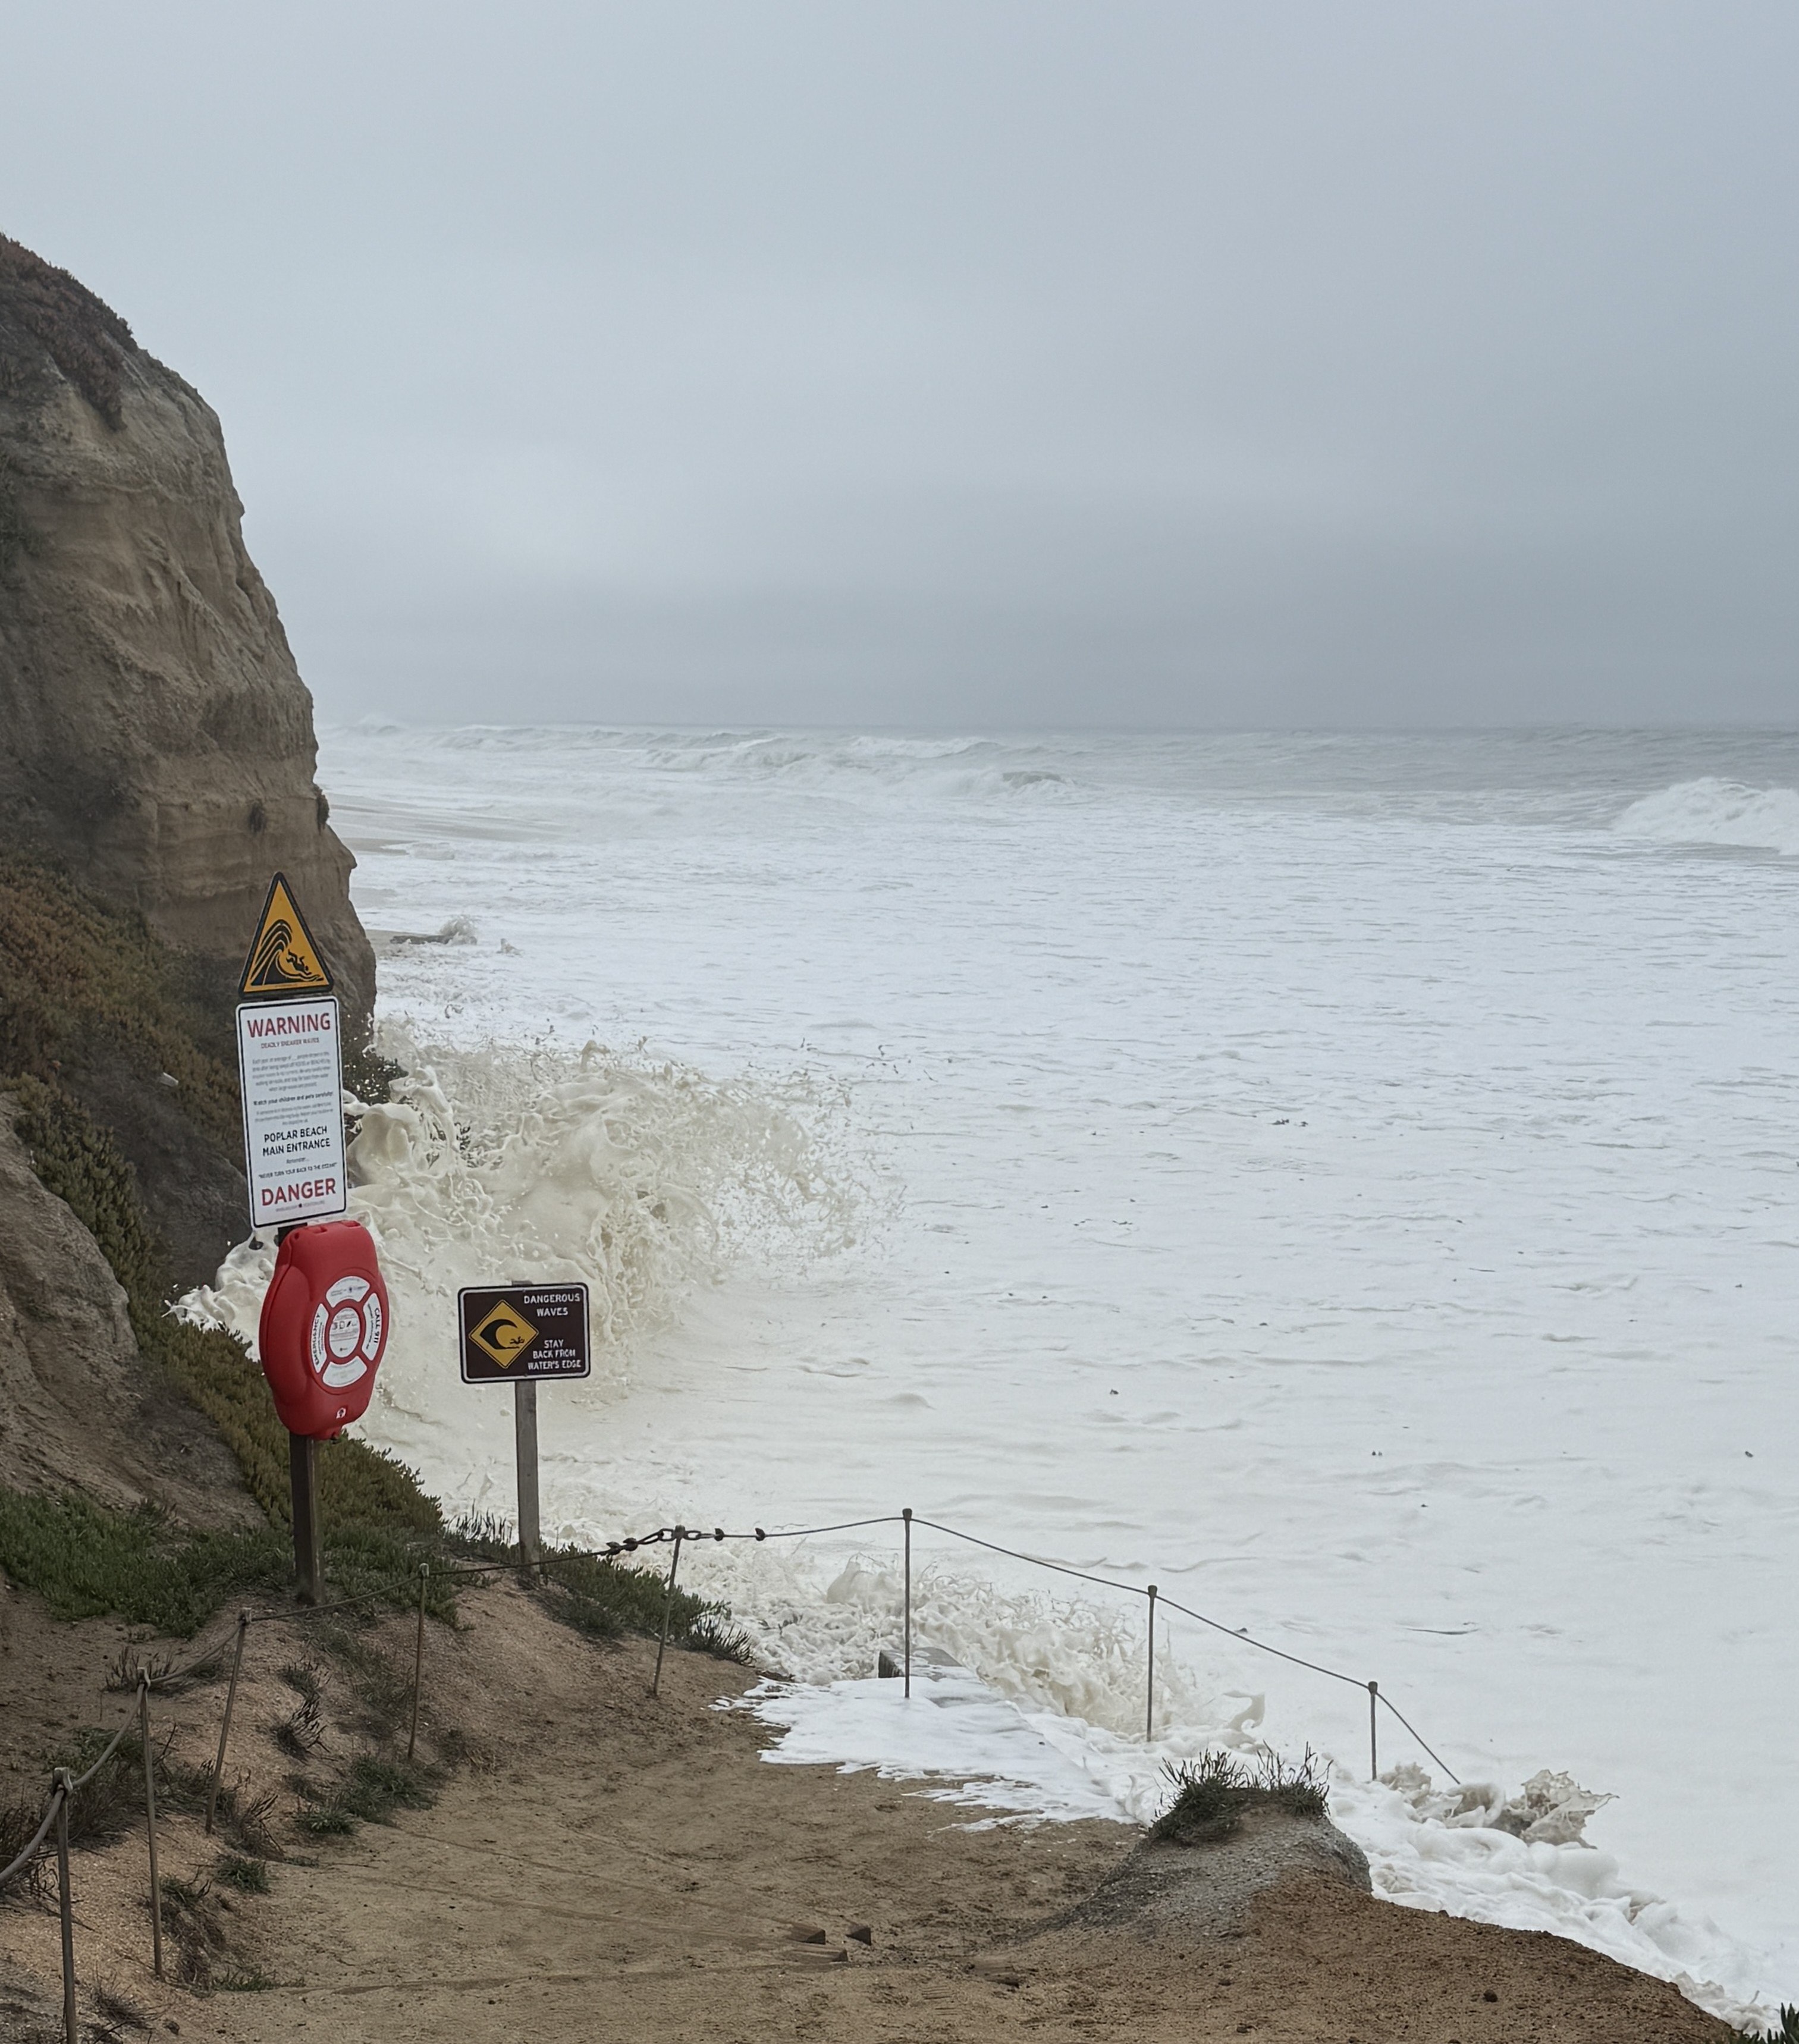
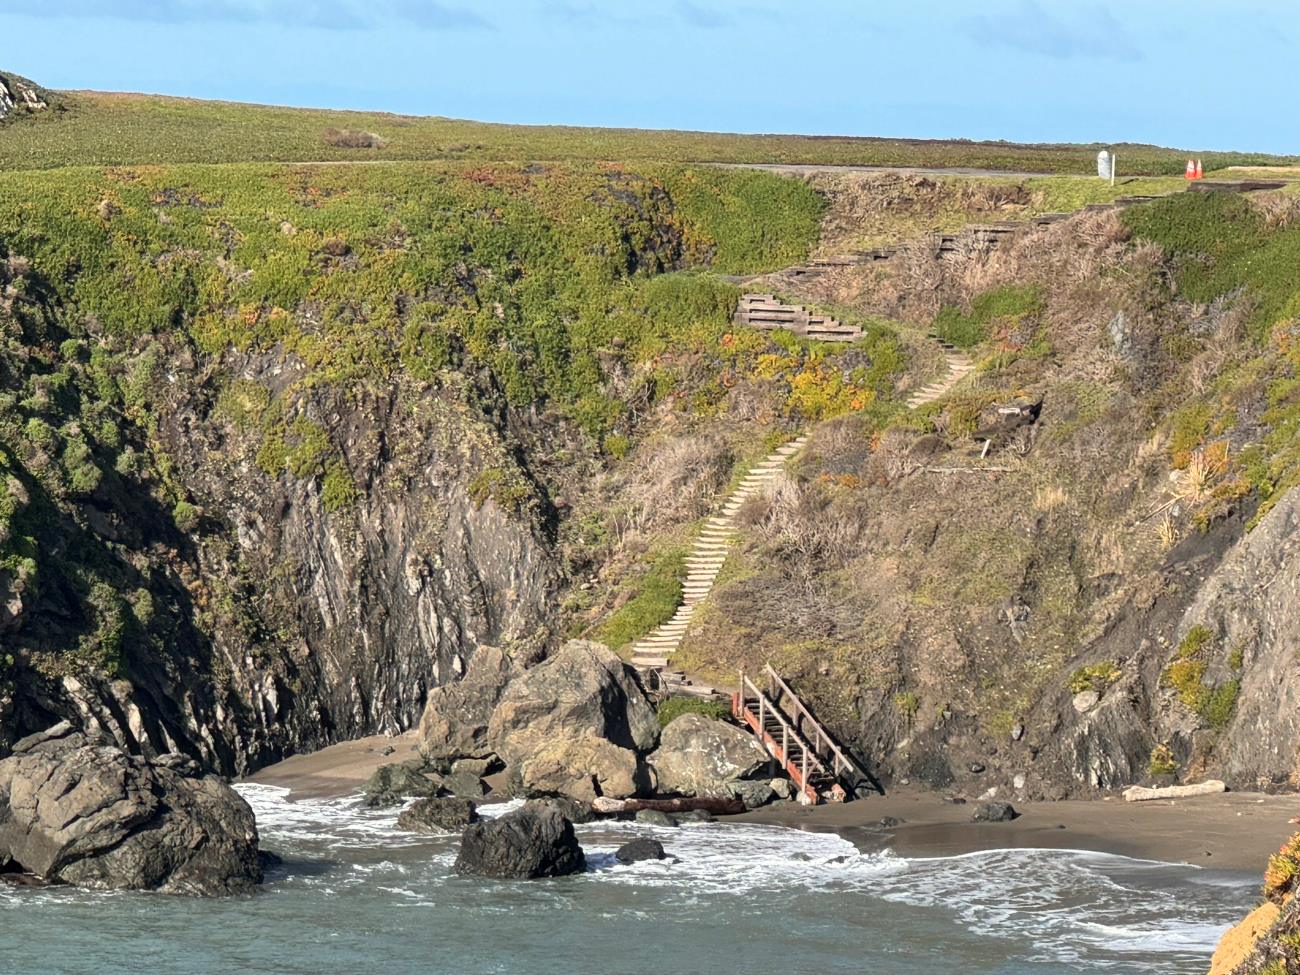
Poplar Beach stairs, Half Moon Bay, 11/6/2025
Burlway Road at Old Bayshore Highway, Burlingame, 1/3/2026
San Gregorio Beach, 11/17/2024
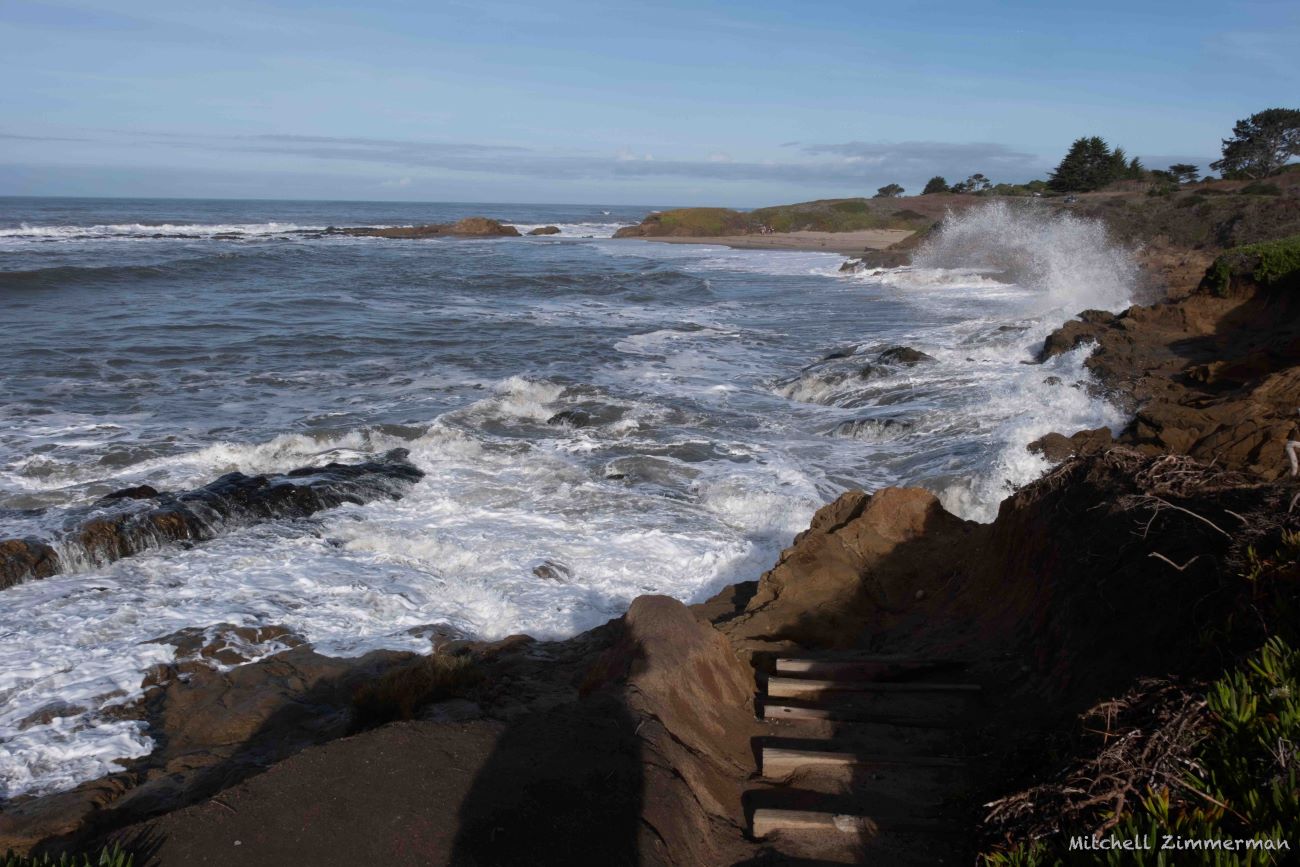
Bean Hollow State Beach, 2/9/2024
Smith Slough, Redwood City, 1/21/2023
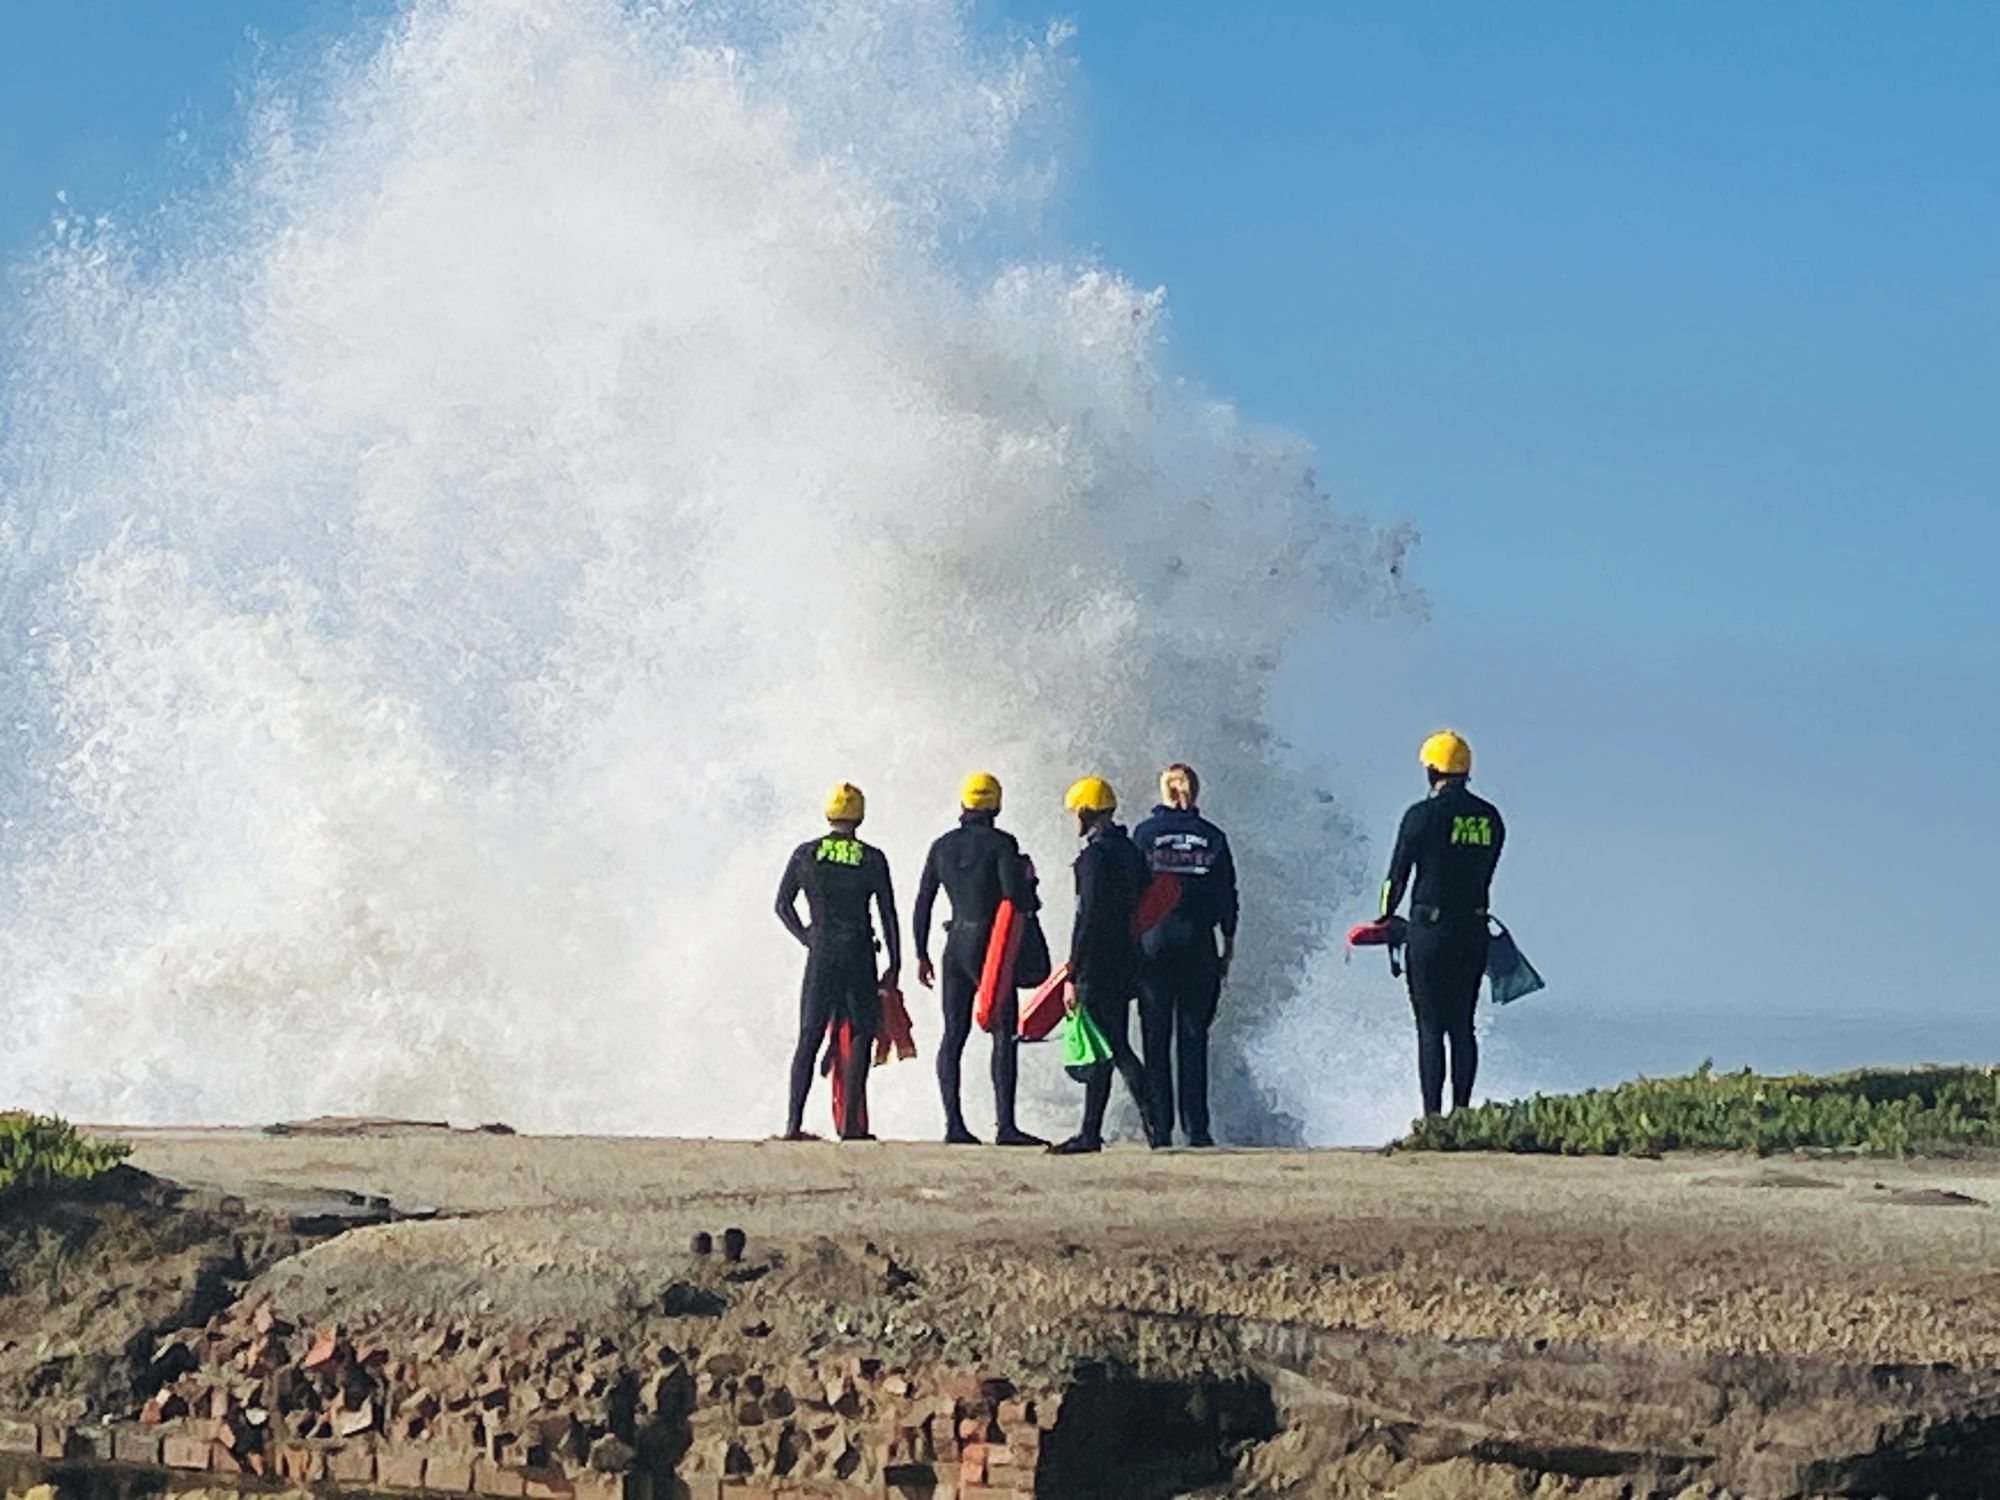
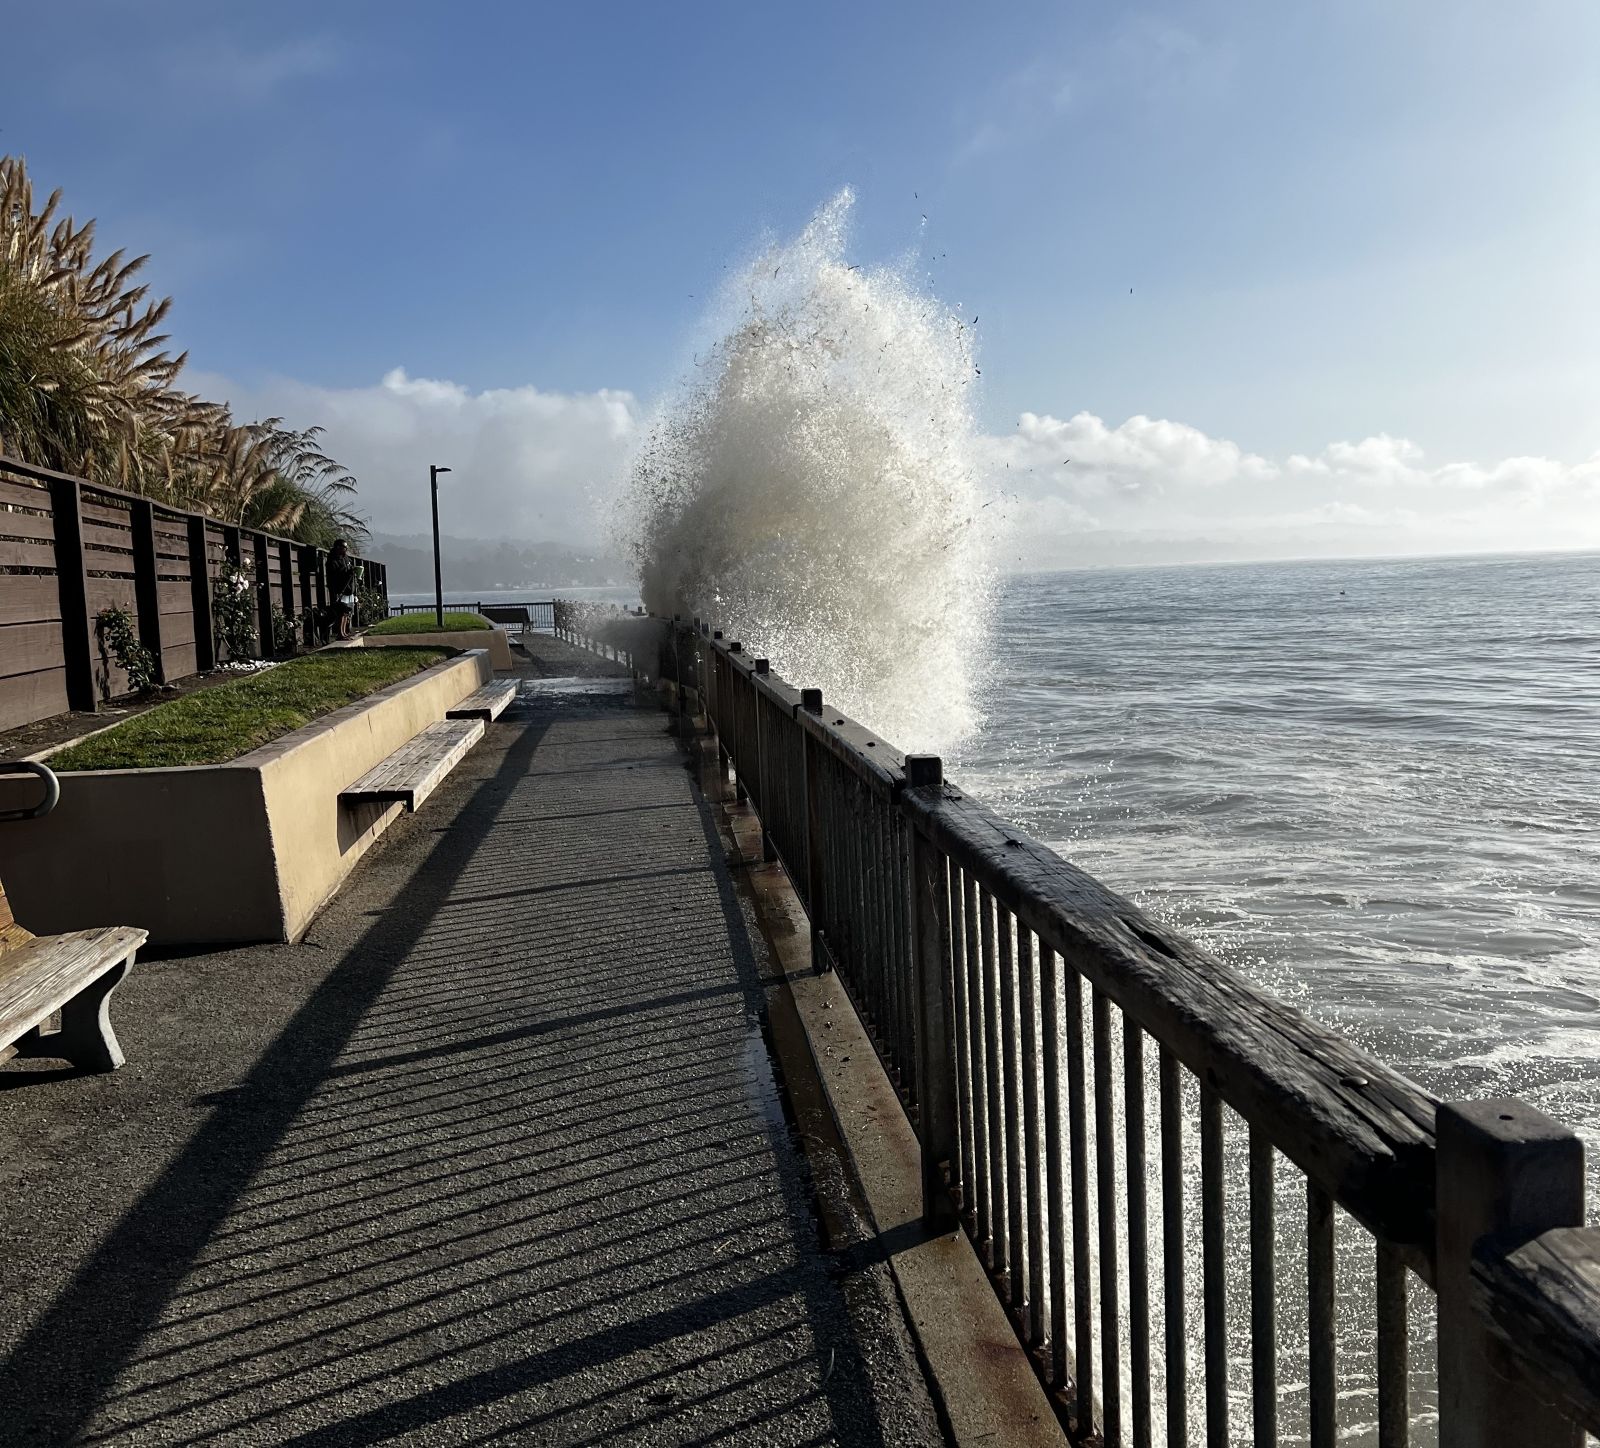
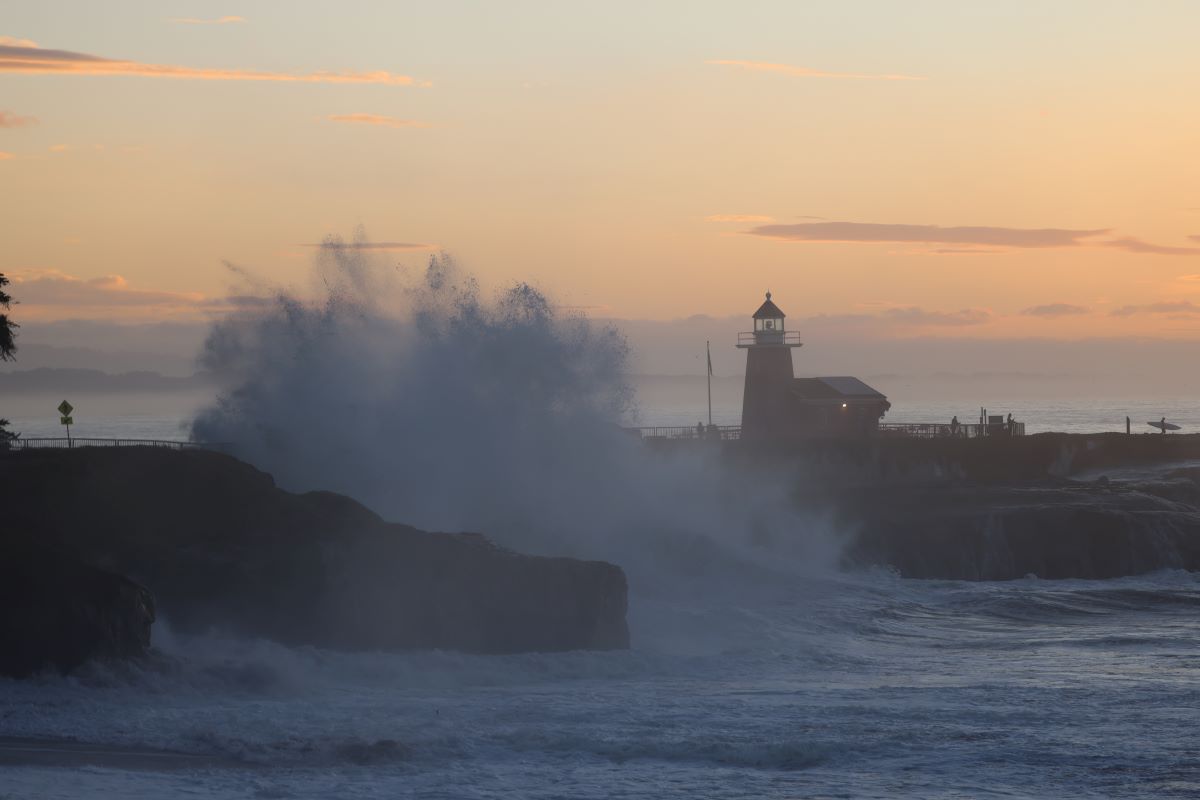
Steamers Lane, Santa Cruz, 11/6/2025
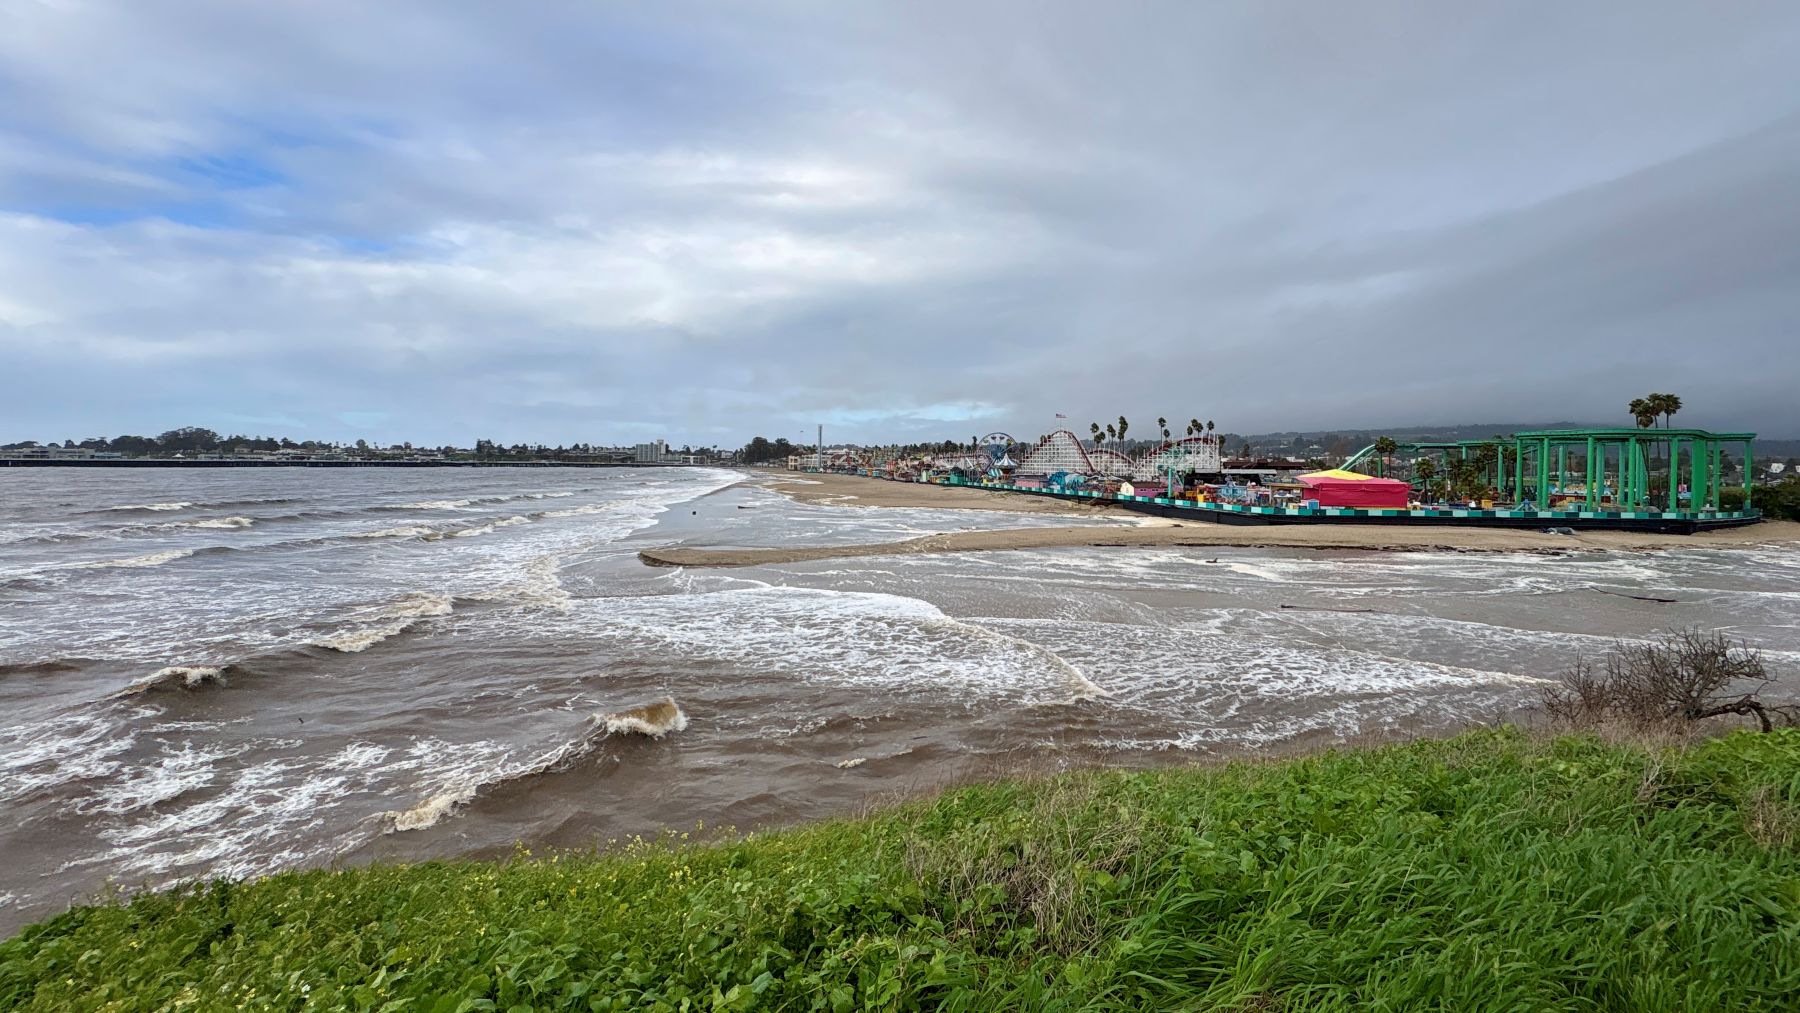
Main Beach, Santa Cruz, 1/3/2026
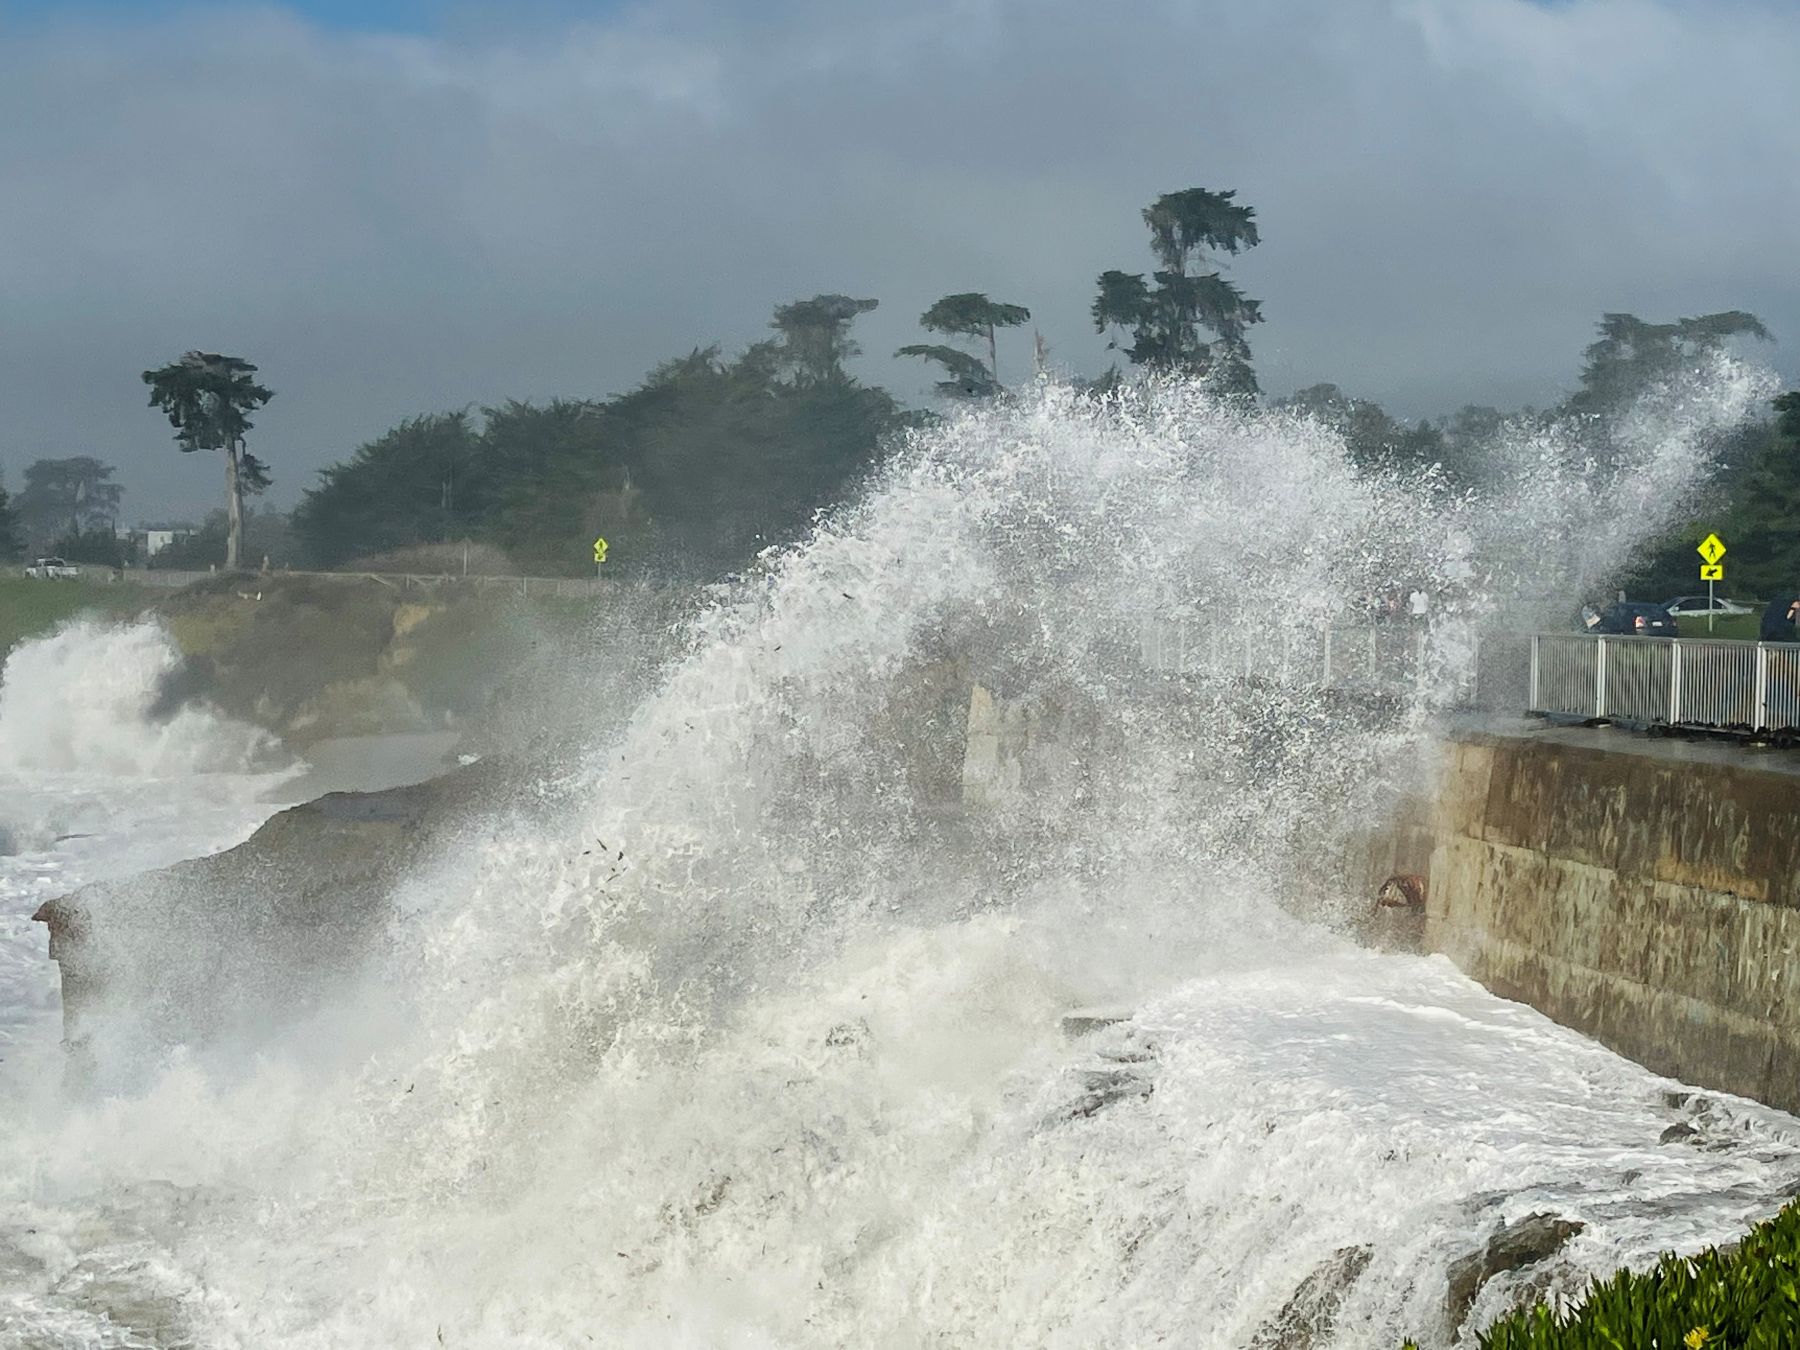
Steamer Lane, West Cliff Drive, Santa Cruz, 11/6/2025
Esplanade Park, Capitola, 11/6/2025
Its Beach, Santa Cruz, 11/15/2024
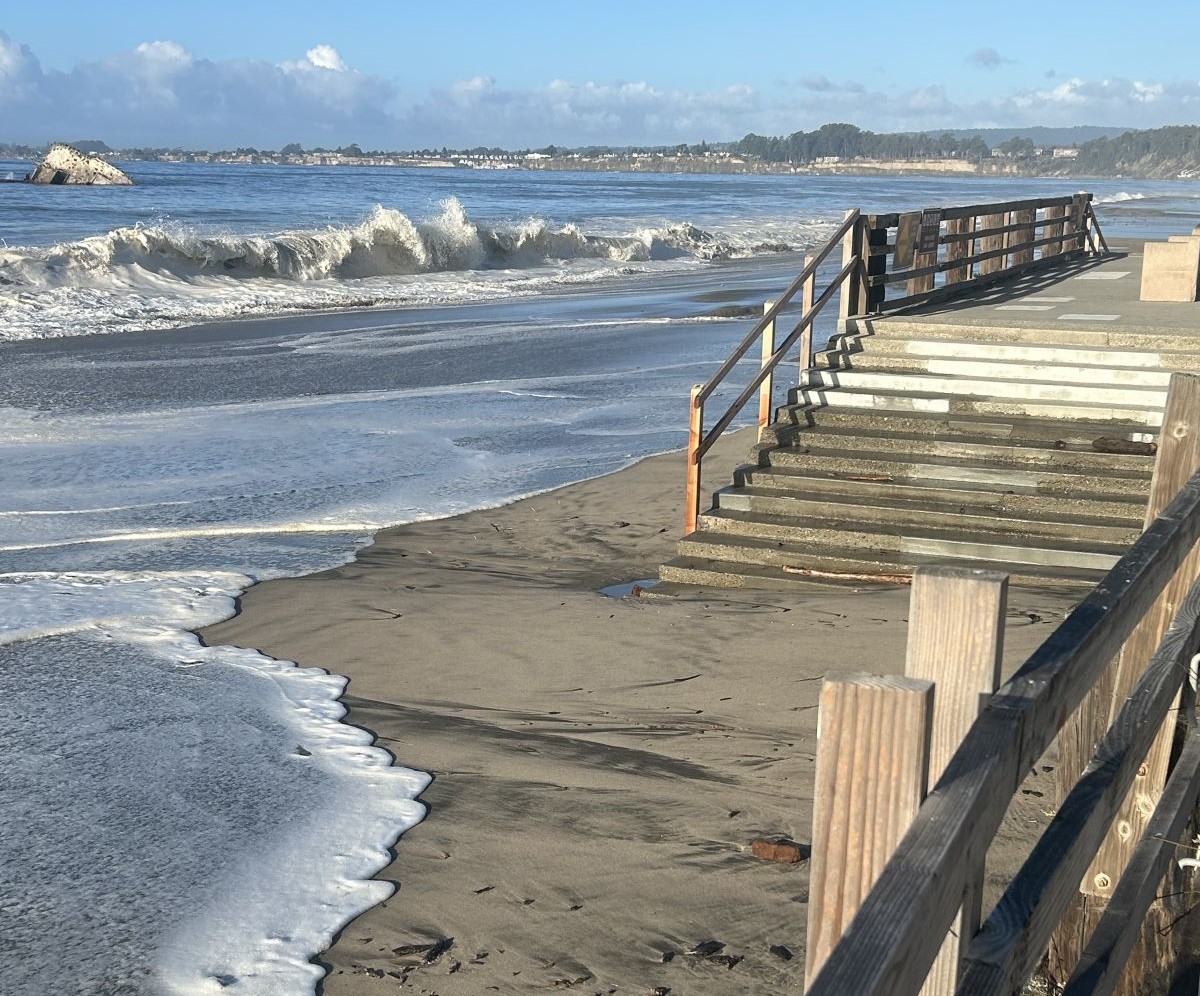
Seacliff Beach, Santa Cruz, 11/15/2024
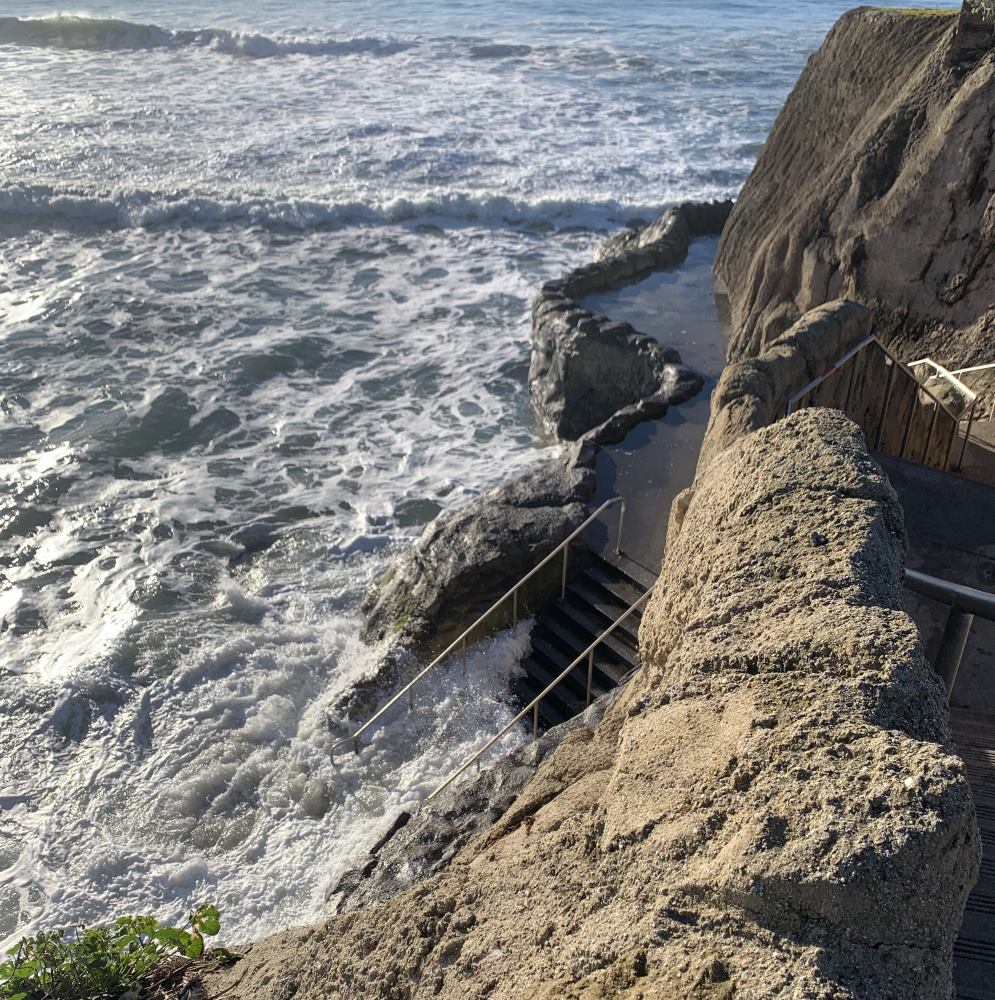
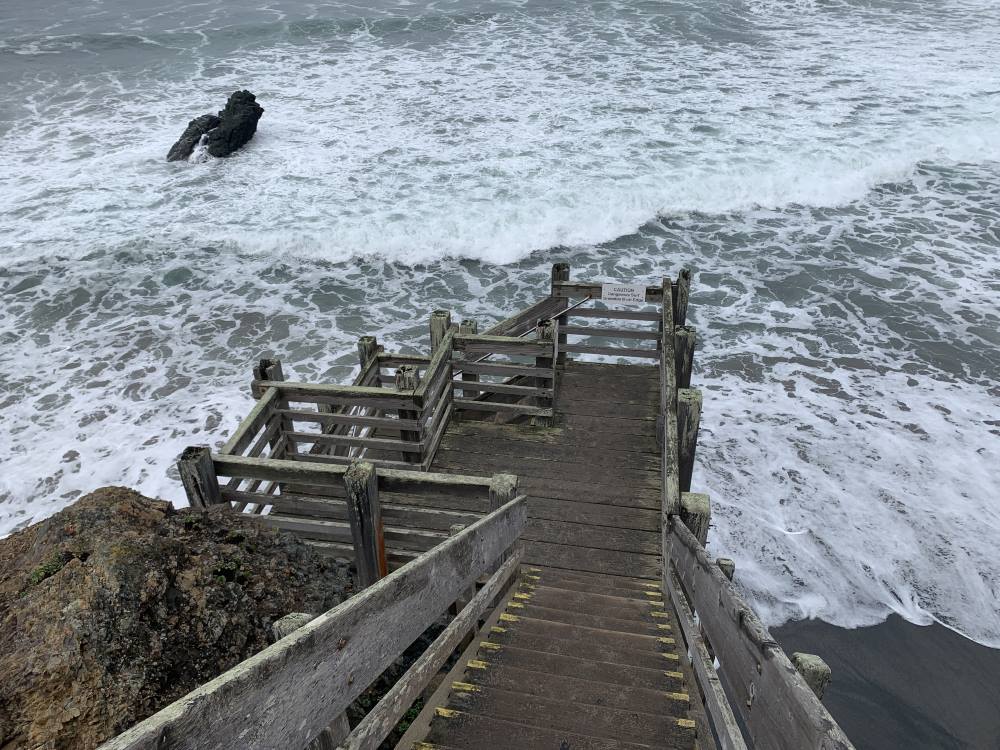
30th Ave stairs at Pleasure Point, Santa Cruz, 1/11/2024
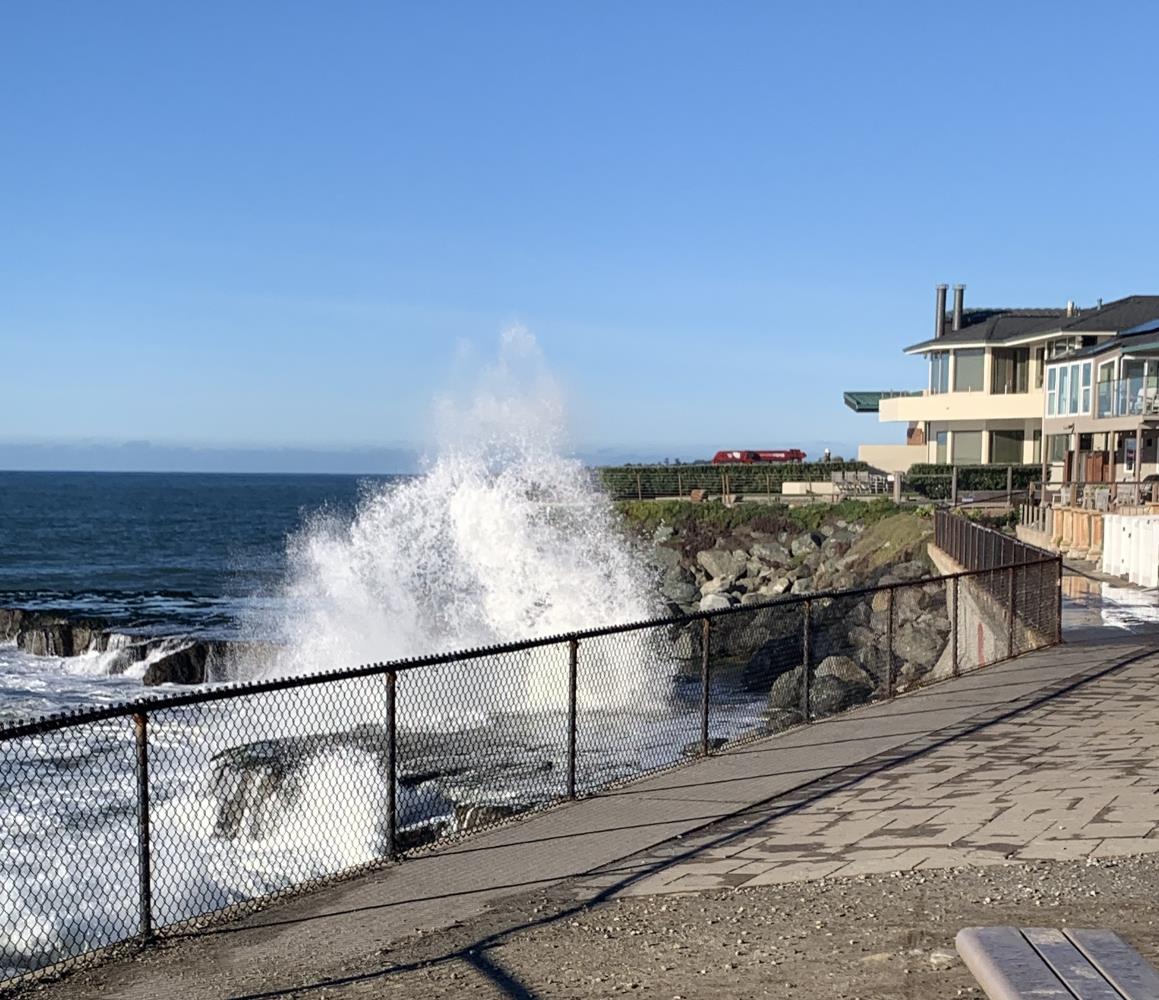
Rockview, Santa Cruz, 1/11/2024
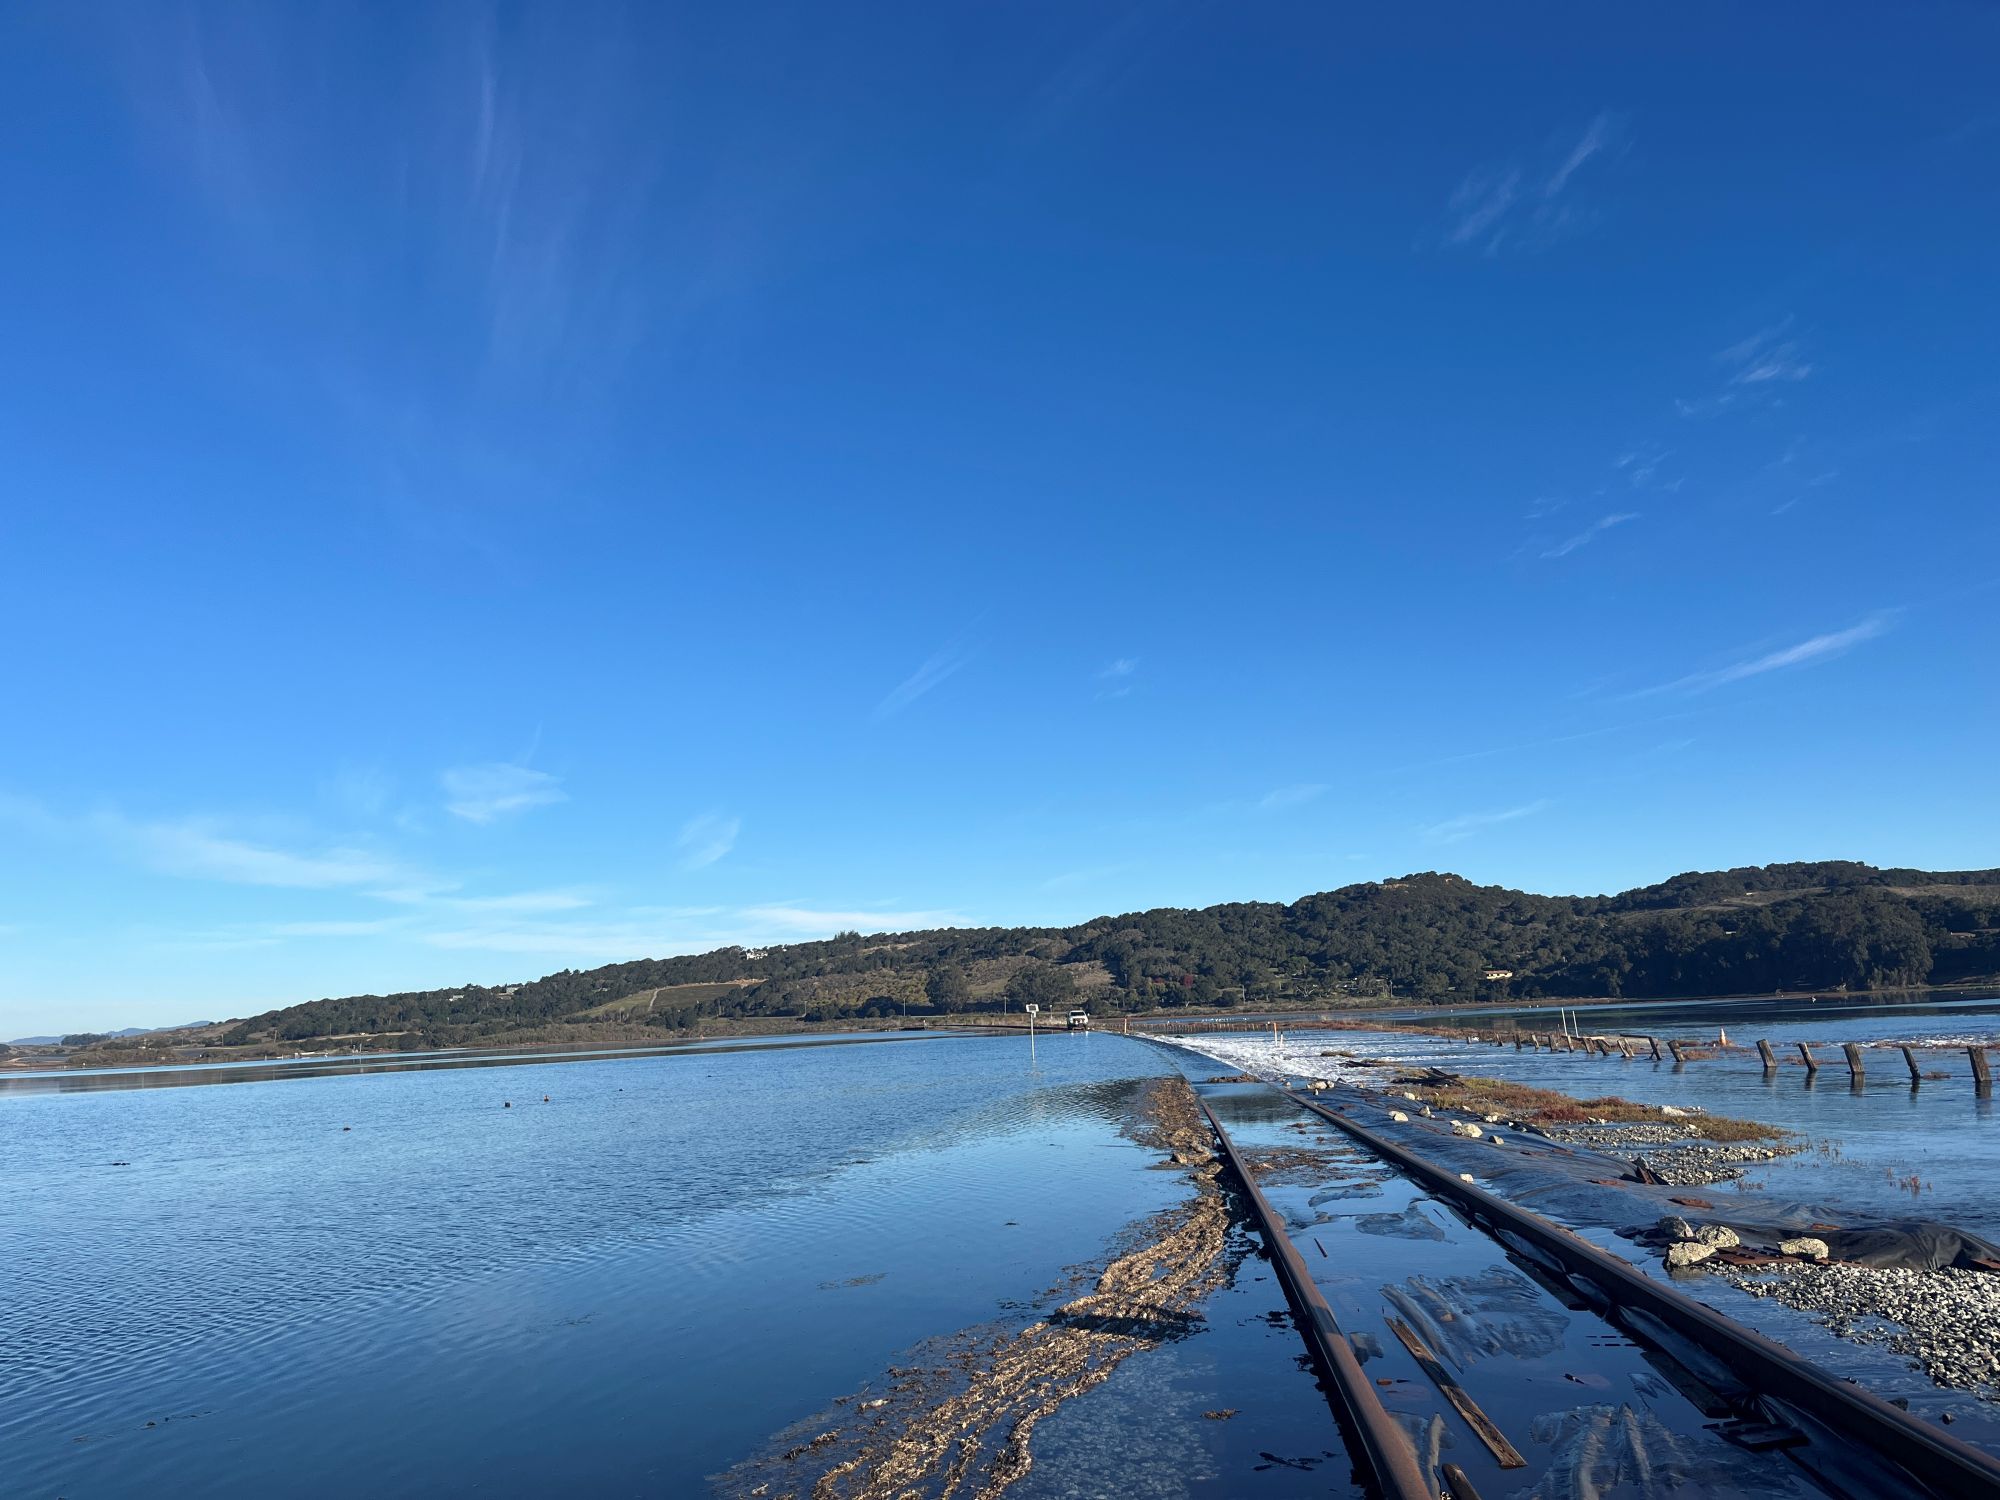
Elkhorn Slough rail line, 12/4/2025
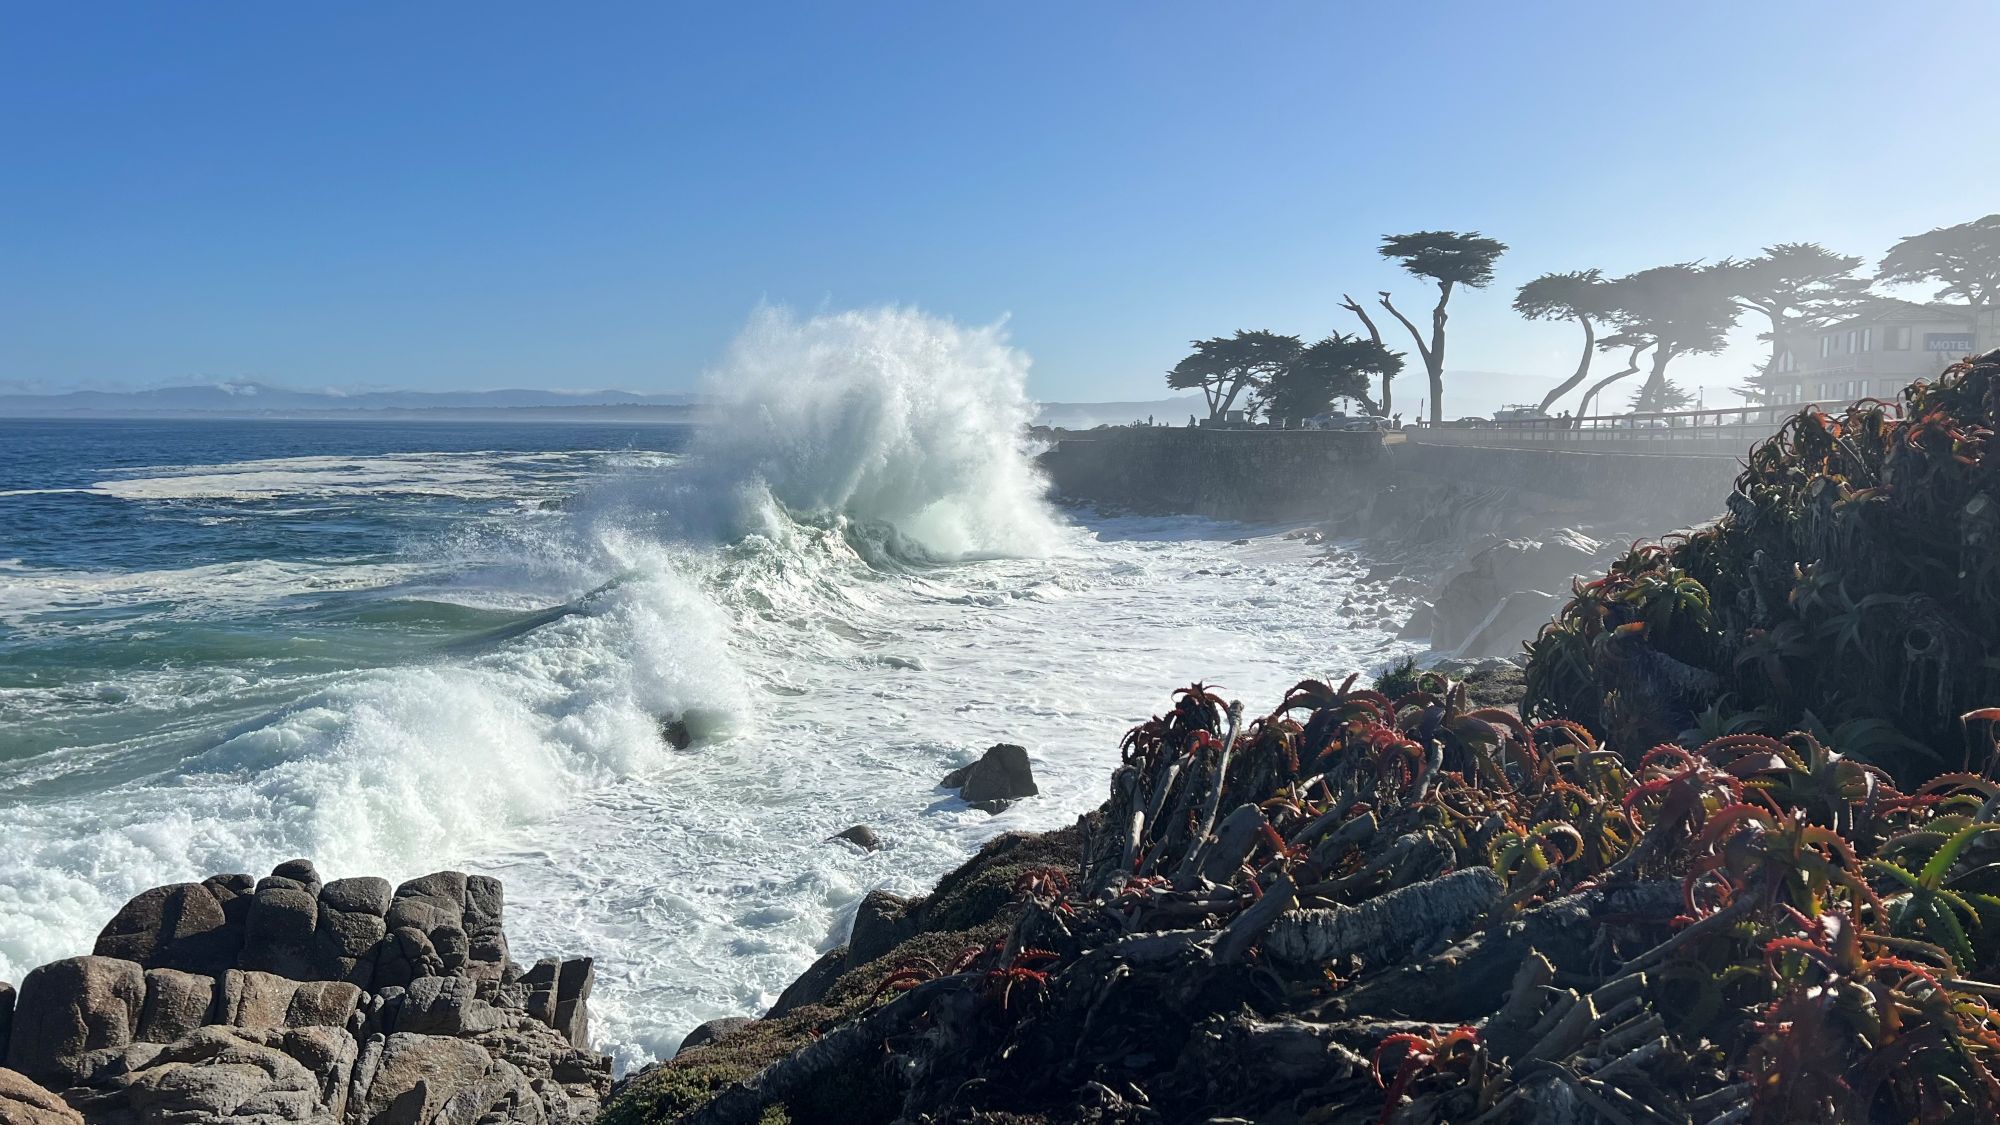
Lovers Point, Pacific Grove, 11/6/2025
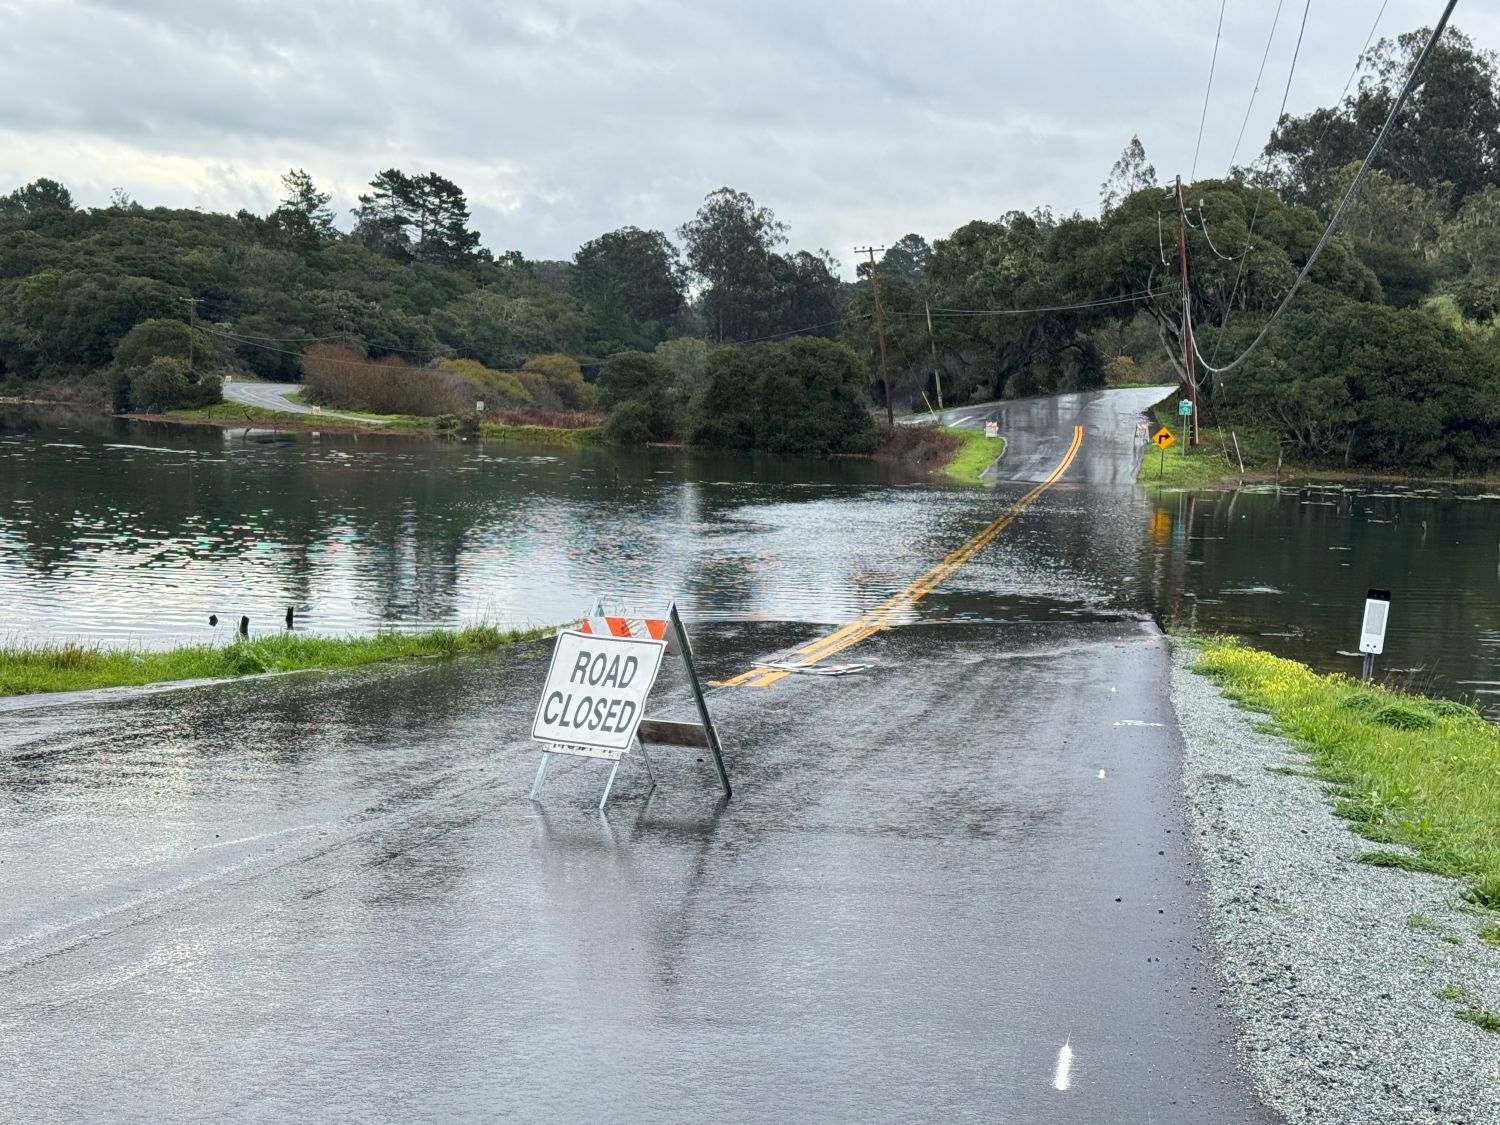
Elkhorn Road at Hidden Valley Road, 1/3/2026
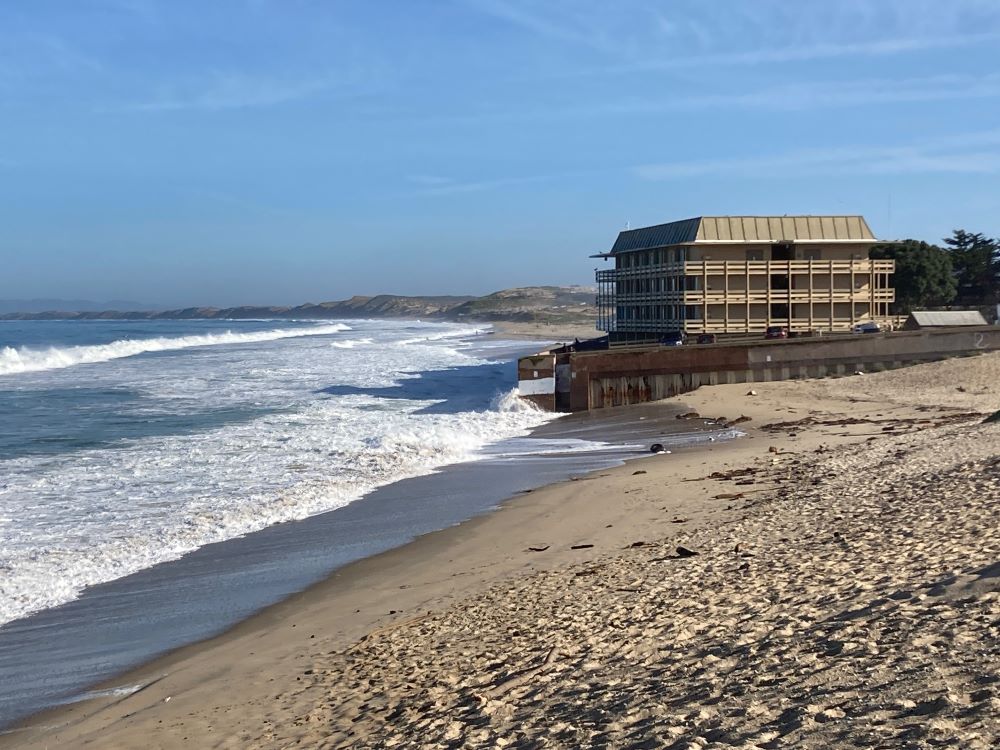
Municipal Wharf #2, Monterey, 12/4/2025
Otter Point, Pacific Grove, 1/3/2026

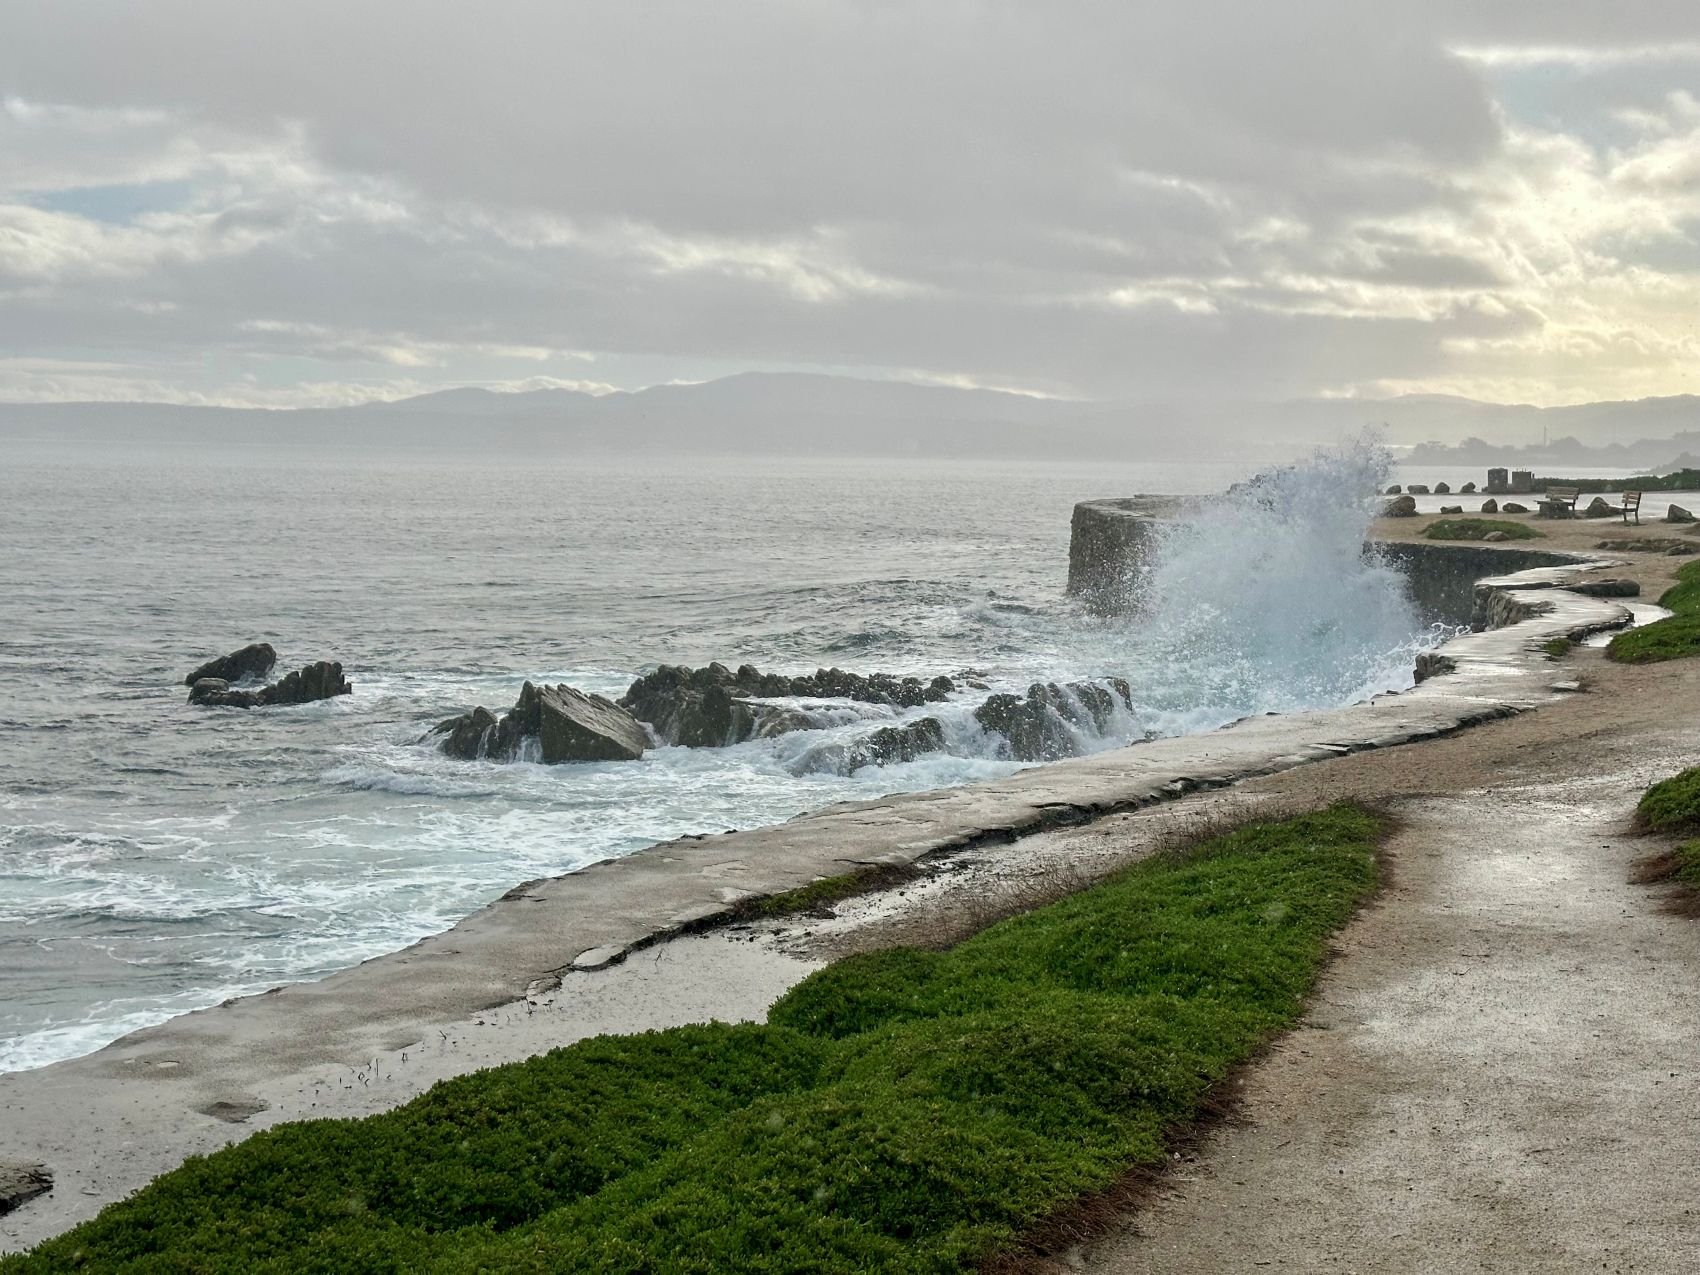
San Carlos Beach, Monterey, 11/16/2024

Monterey Beach Station, 12/15/2024
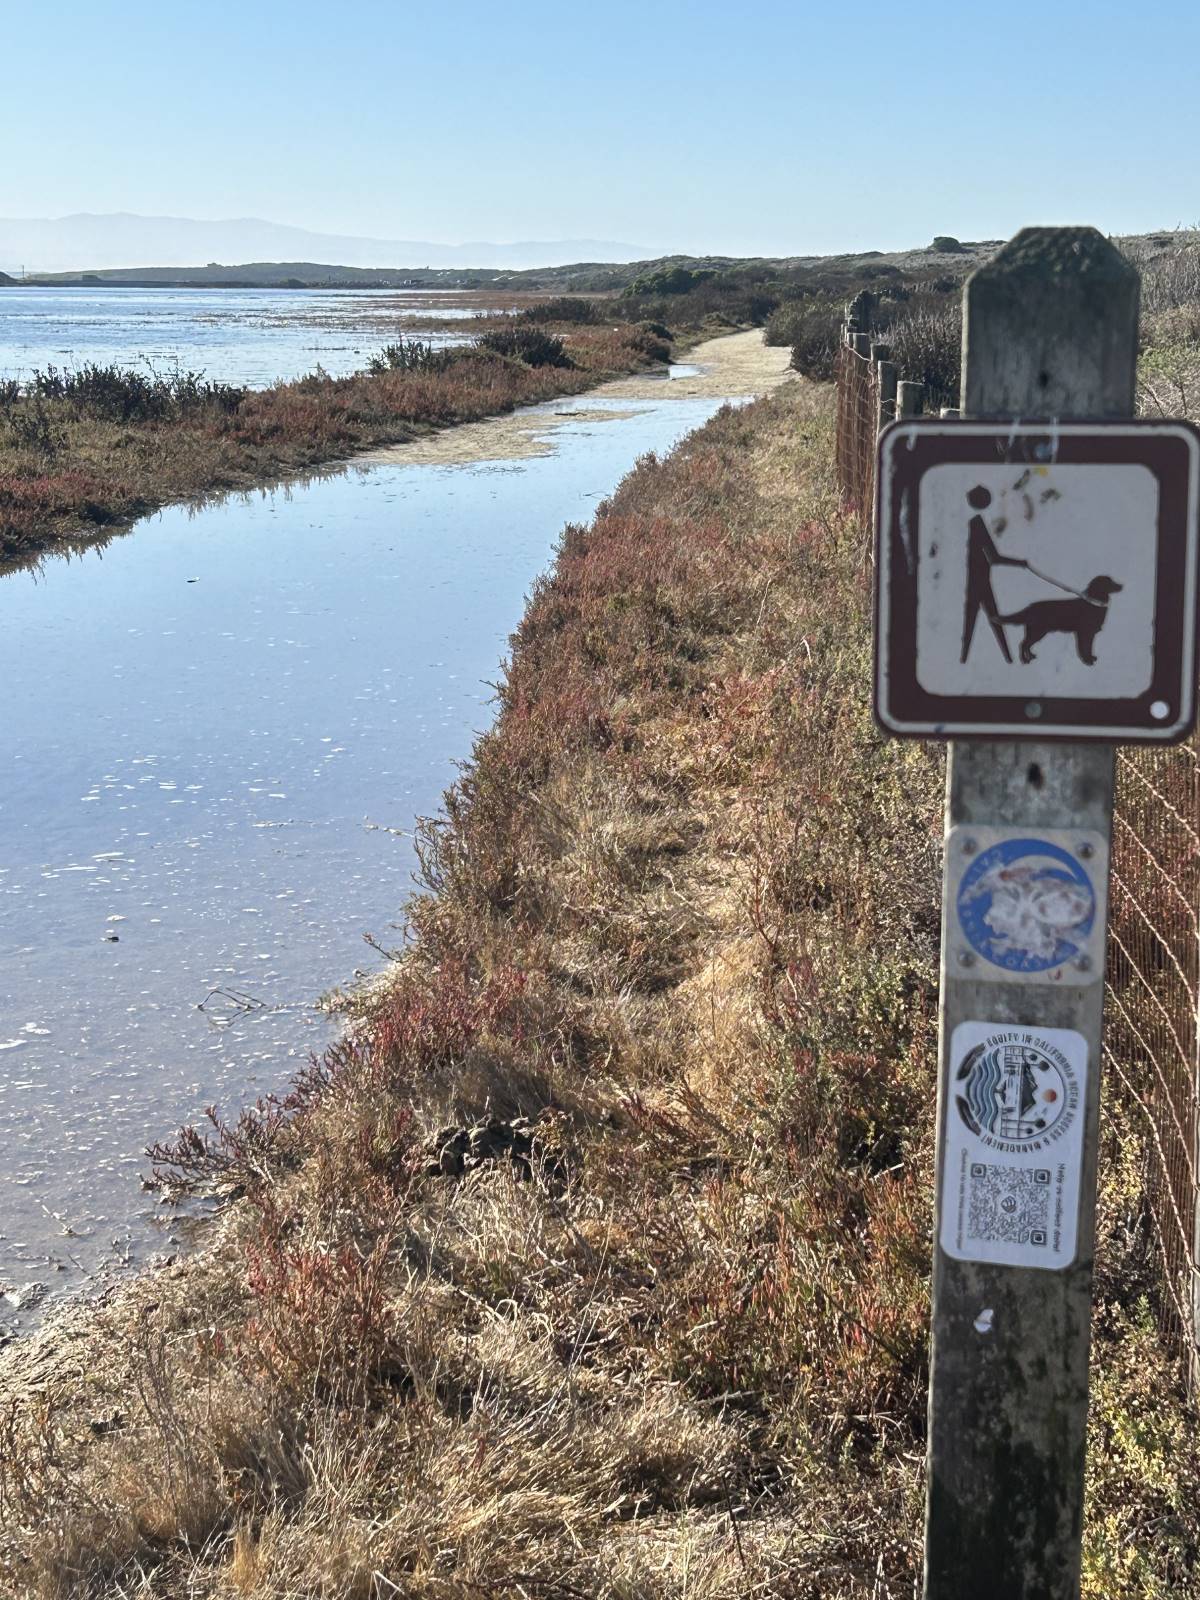
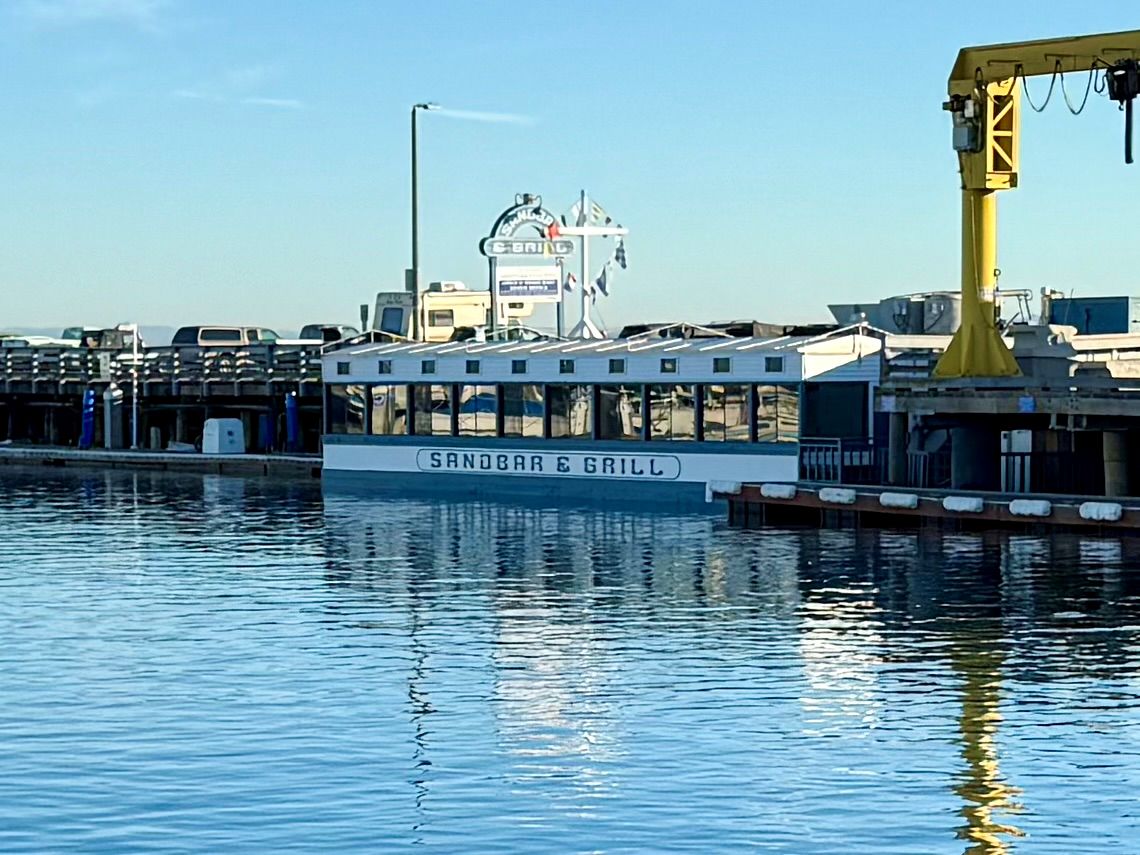
Moss Landing, 11/16/2024

Elkhorn Slough Reserve, 11/16/2024

Carmel Beach, 11/16/2024
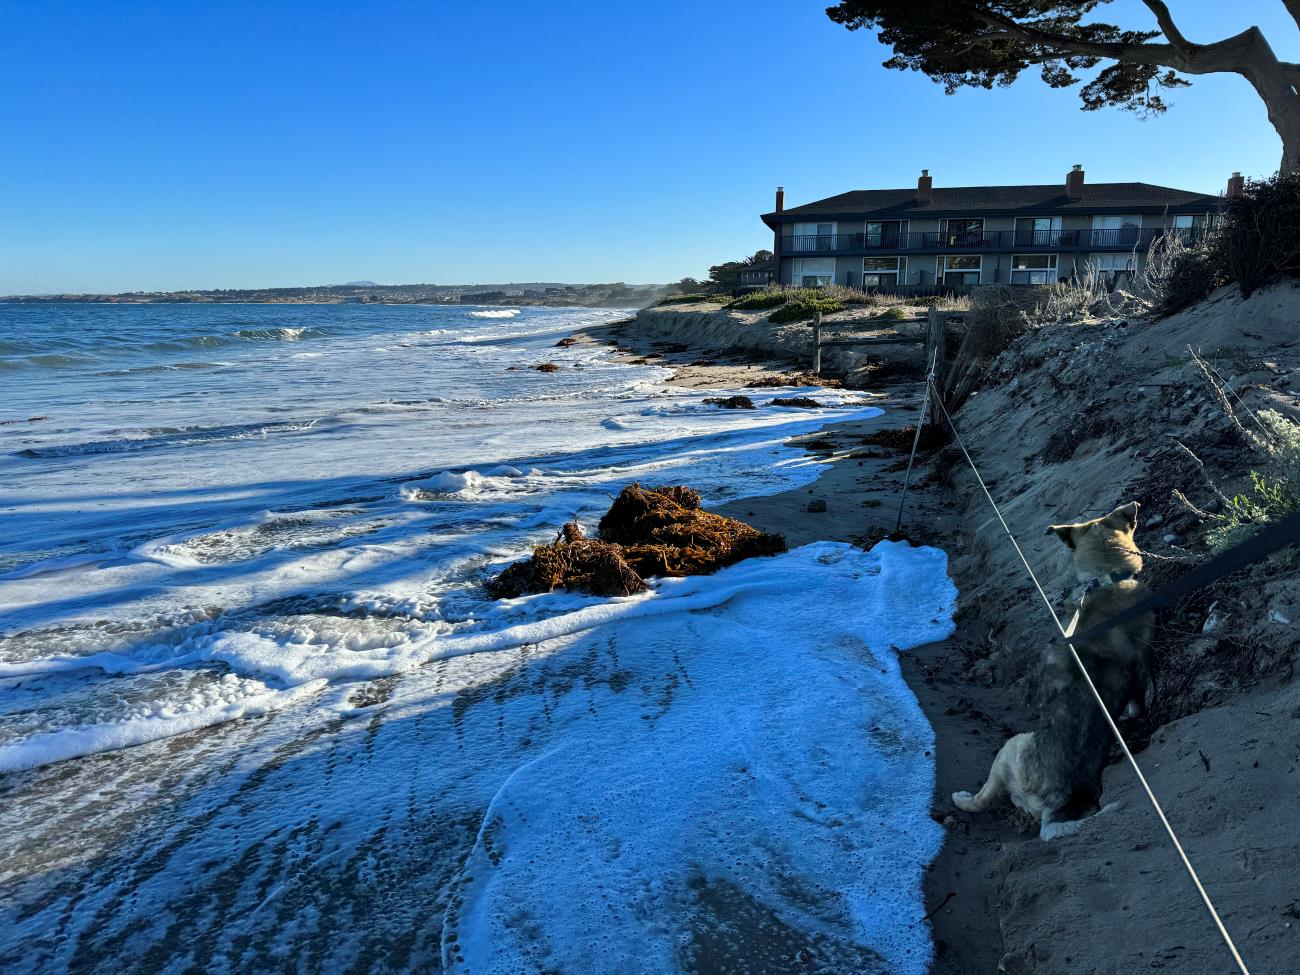
Del Monte Beach, Monterey, 1/11/2024
Seaside, 1/23/2023
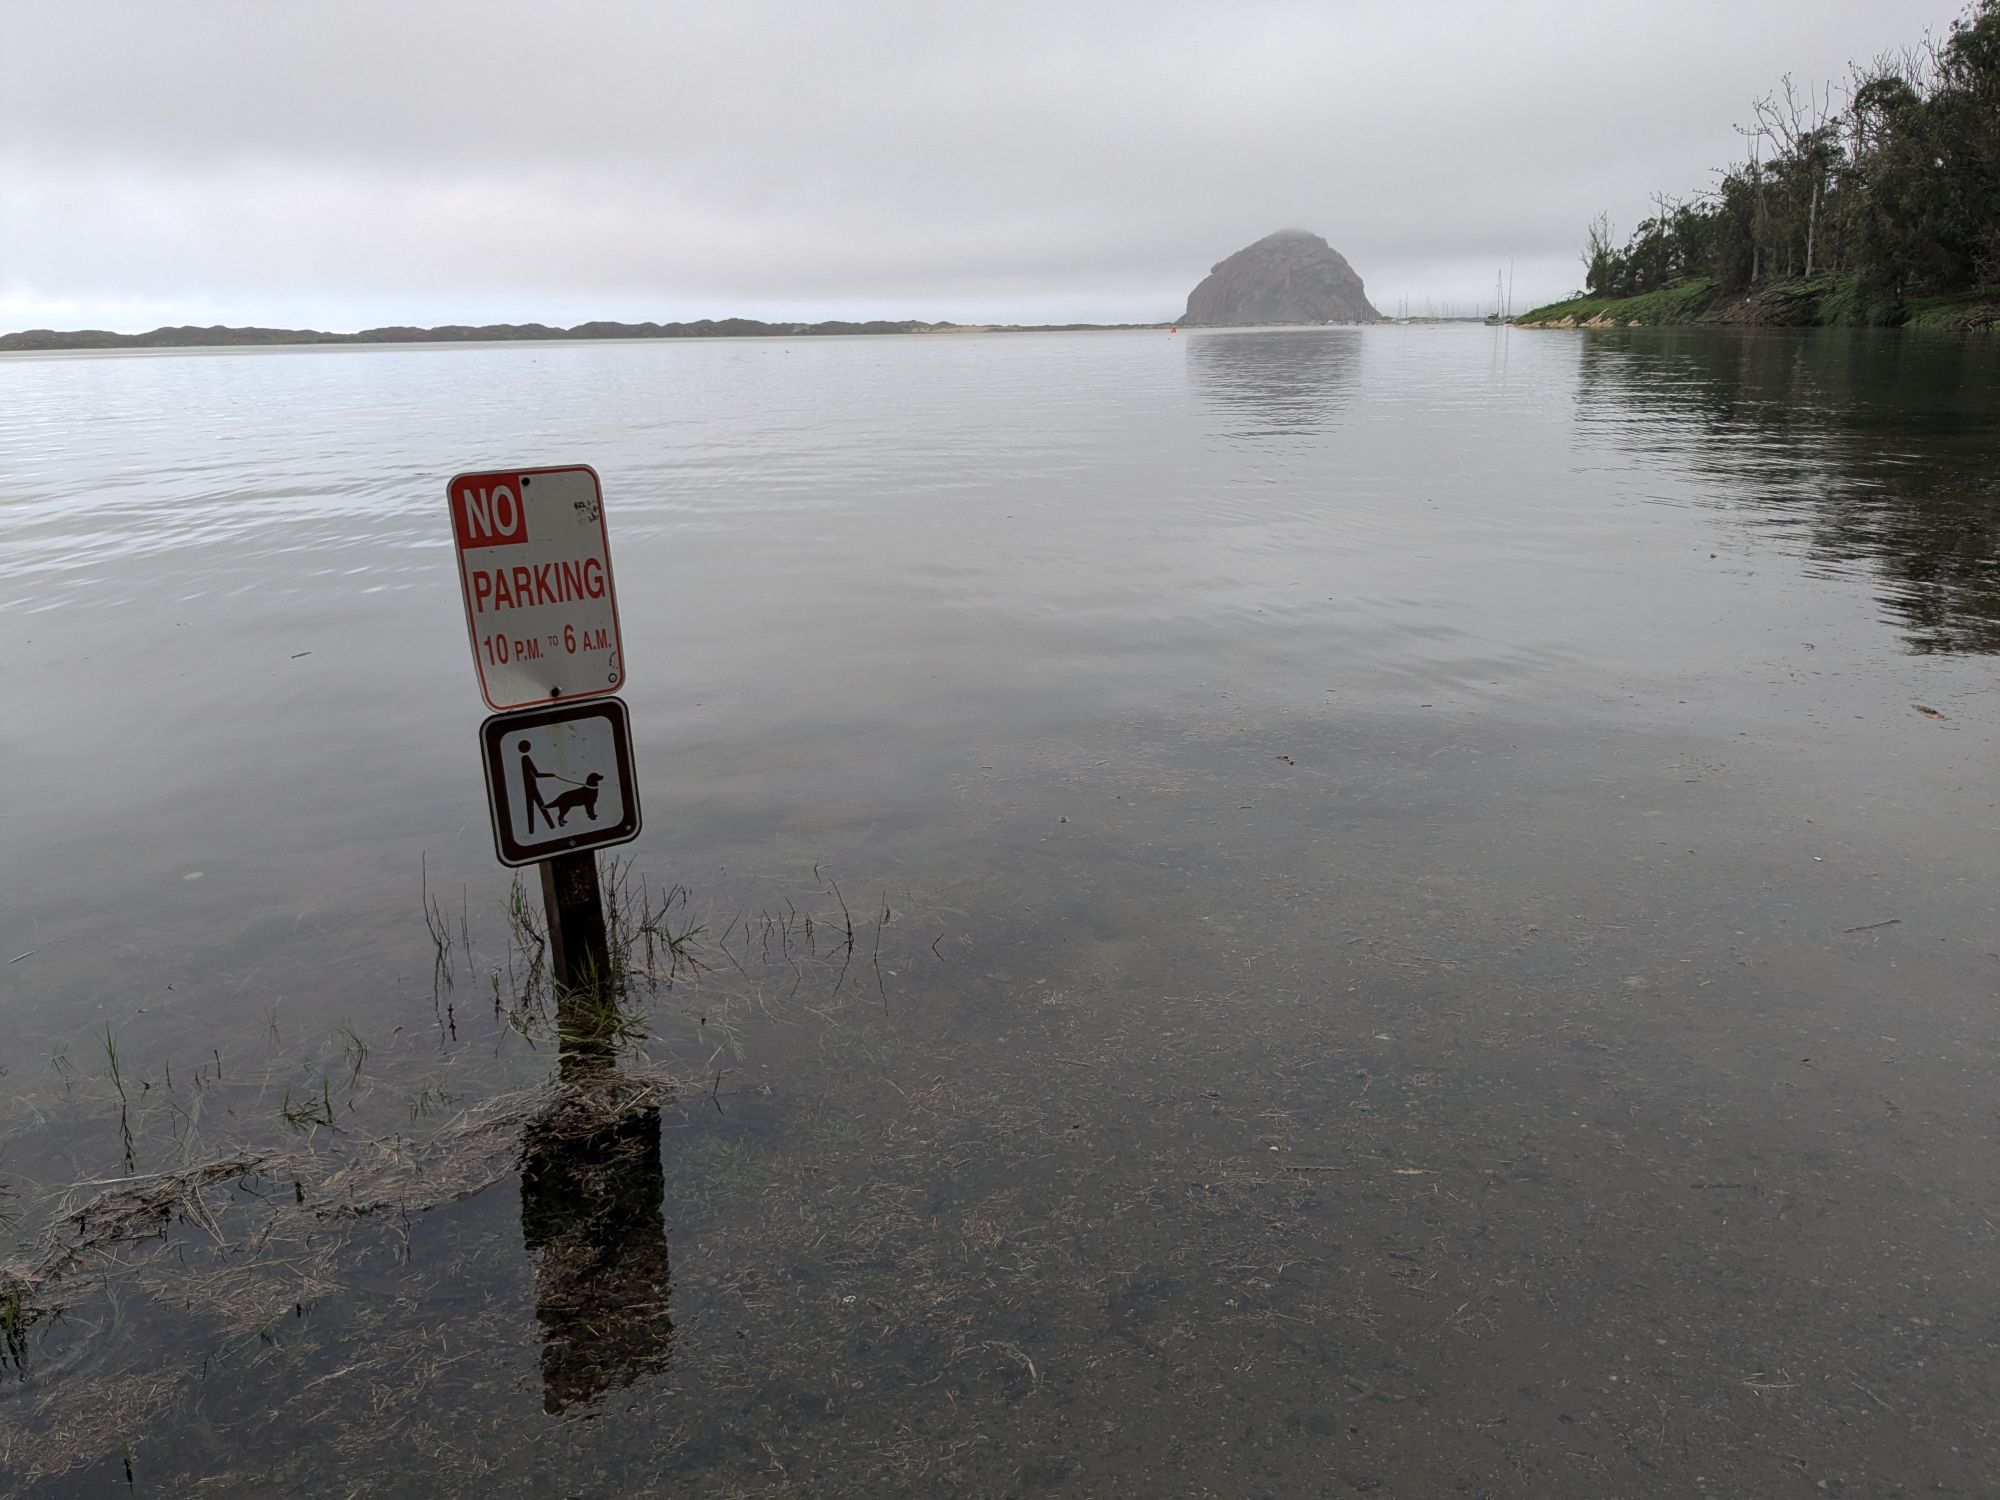
Windy Cove, Morro Bay State Park, 1/3/2026
Moonstone Beach, Cambria, 12/6/2025
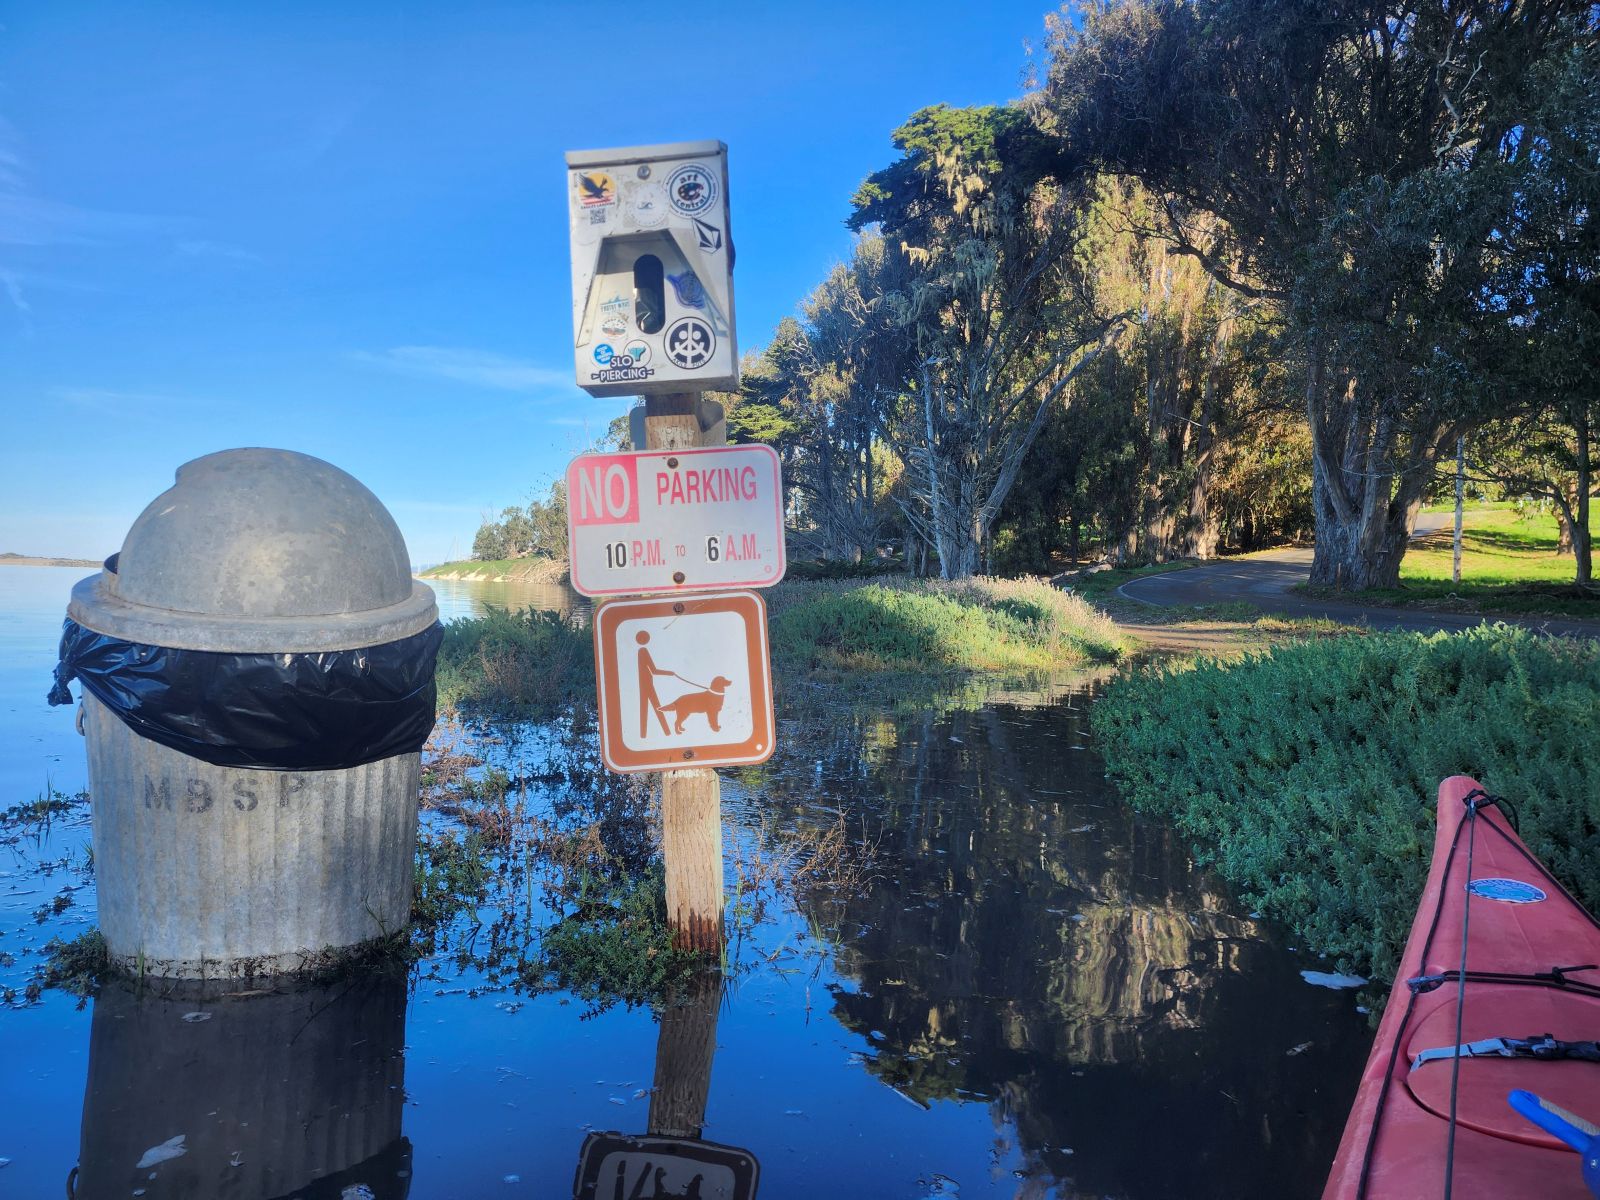
Windy Cove, Morro Bay State Park, 12/4/2025
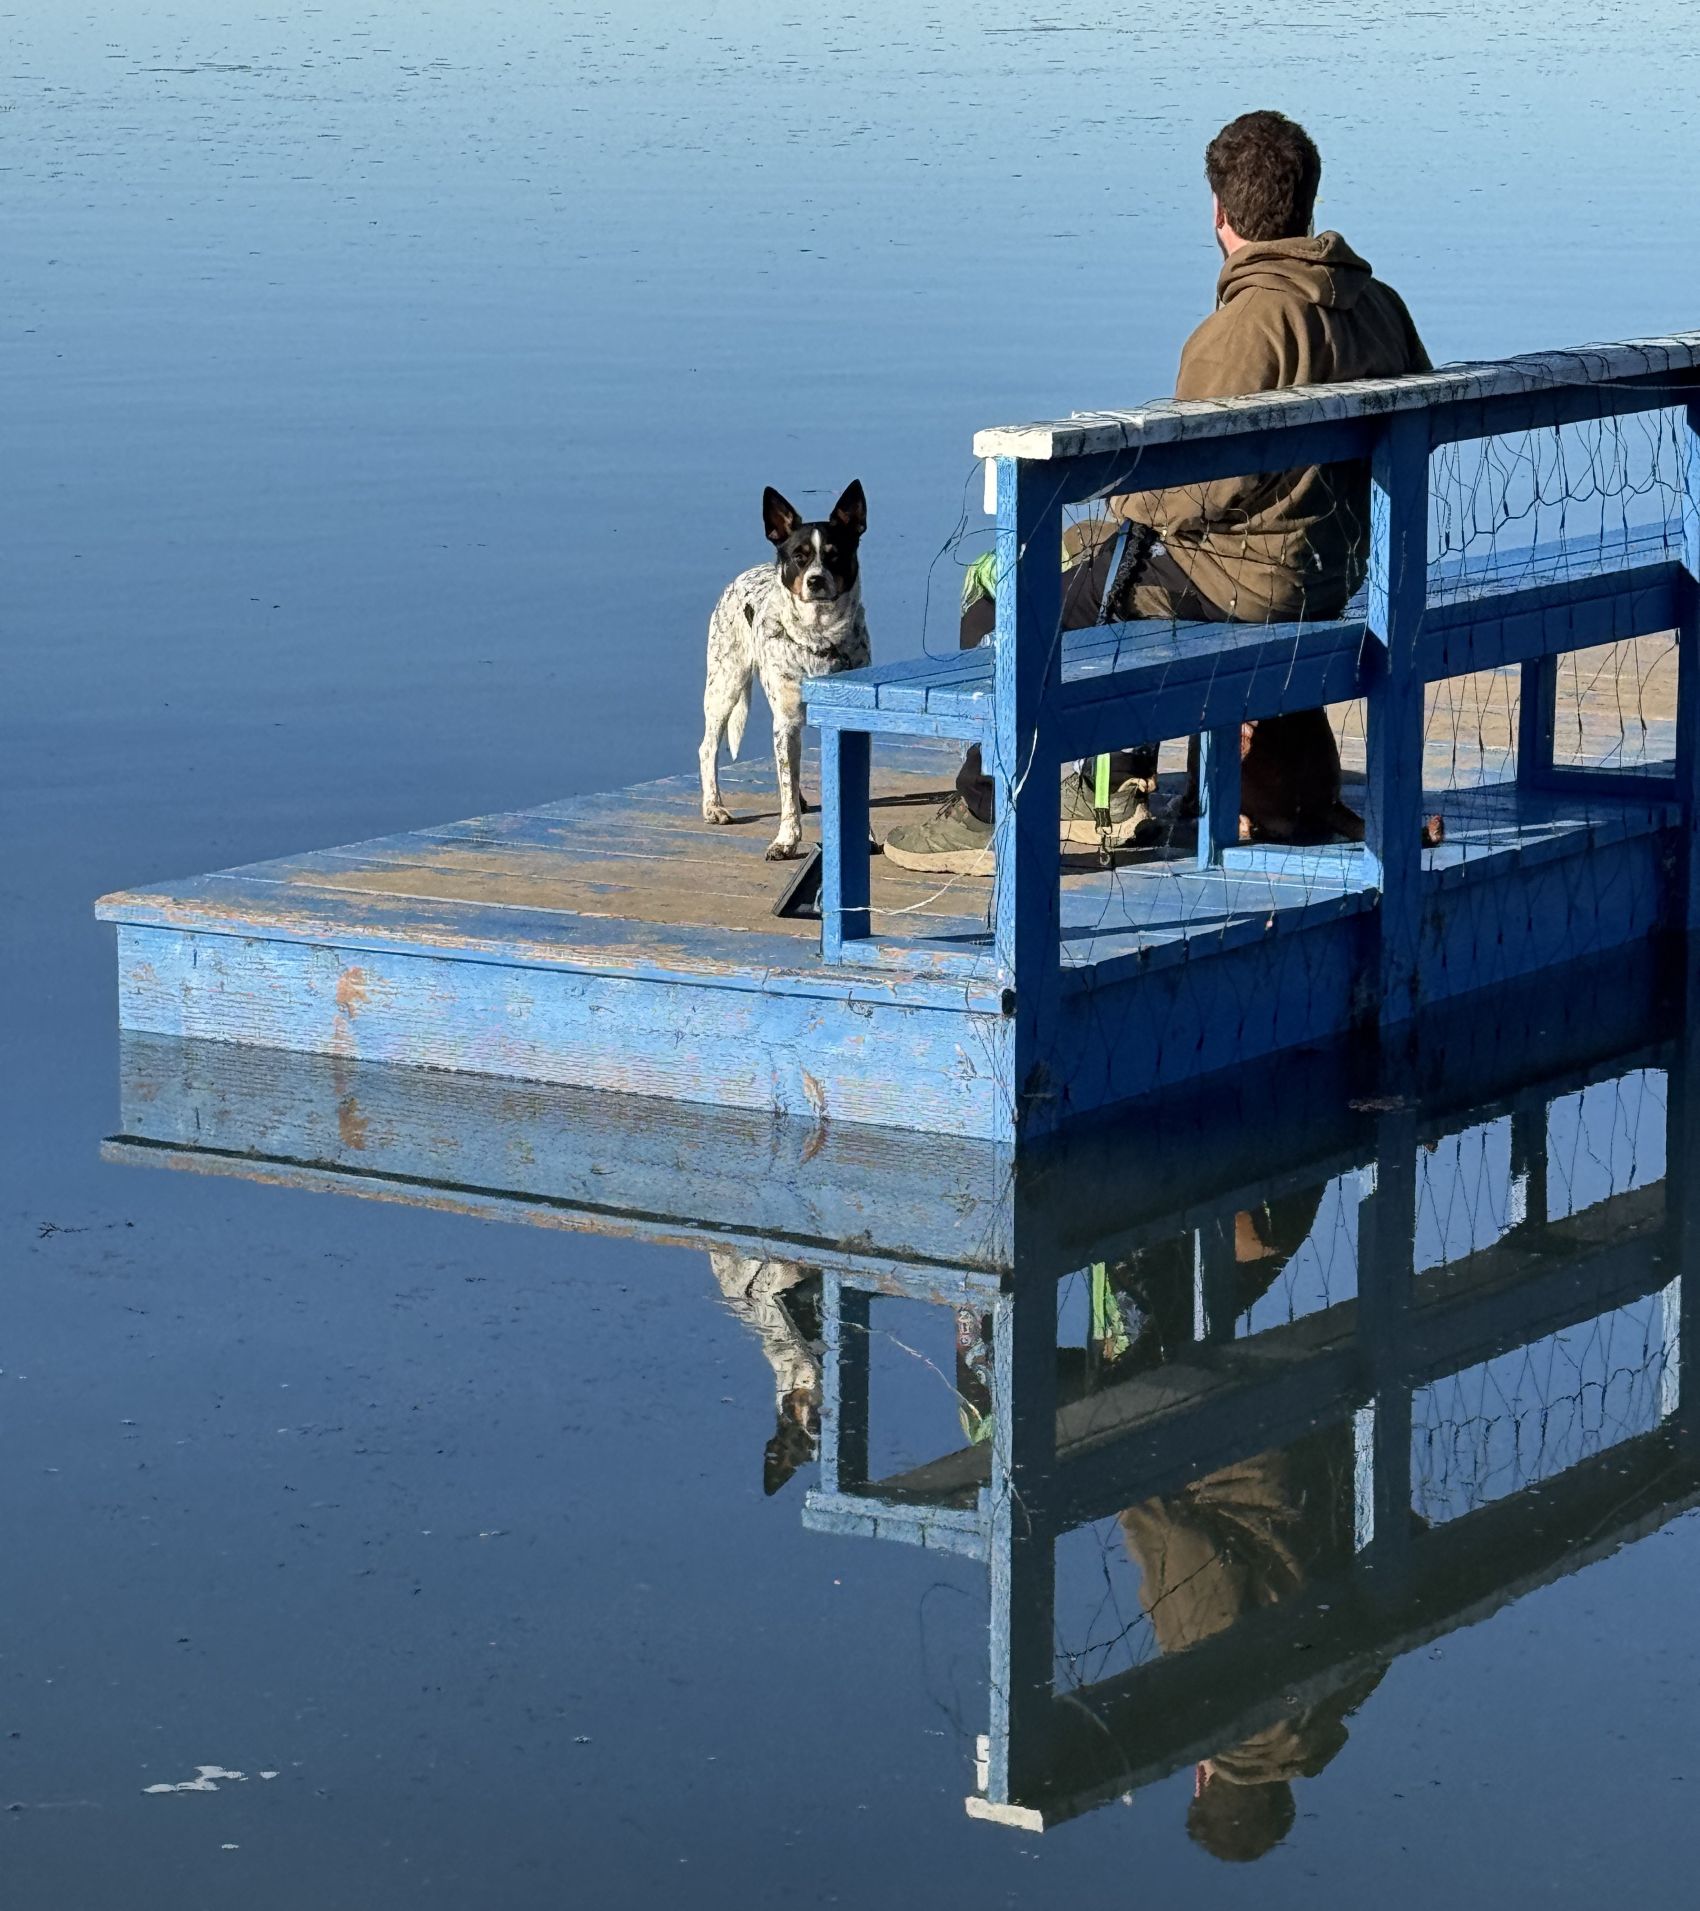
Blue Dock, Los Osos, 12/5/2025
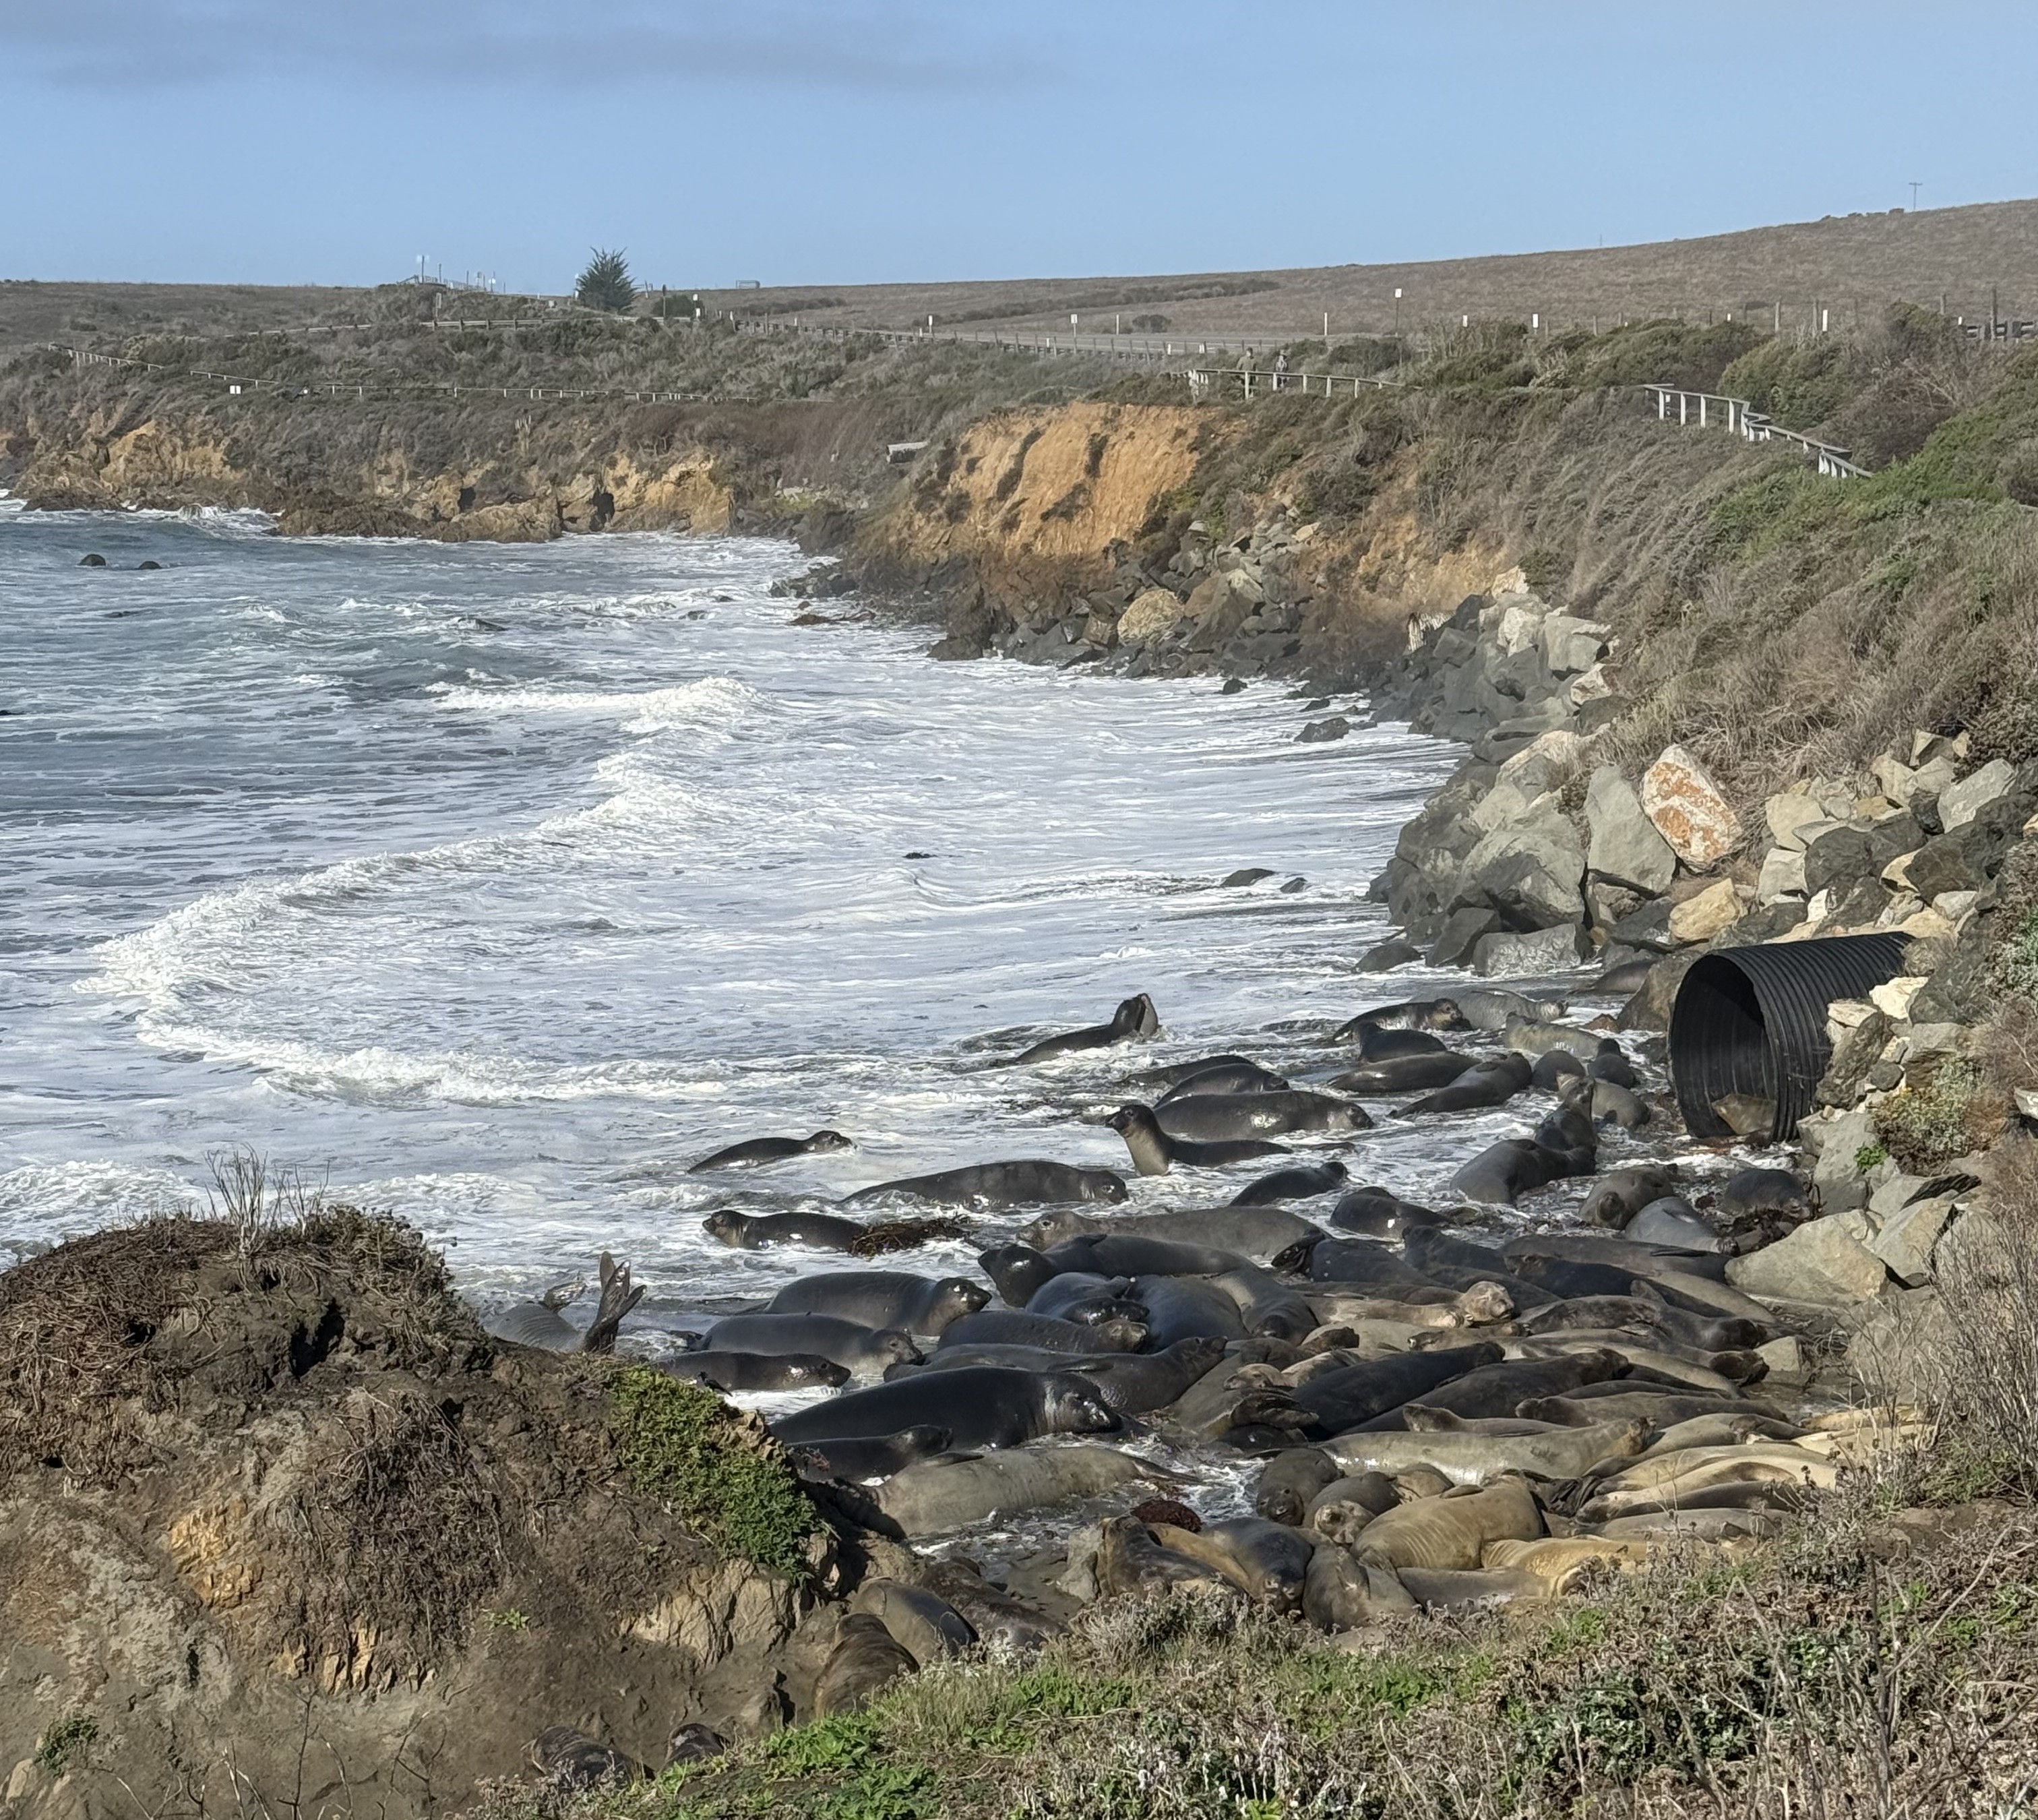
Piedras Blancas elephant seal viewpoint, San Simeon, 11/6/2025
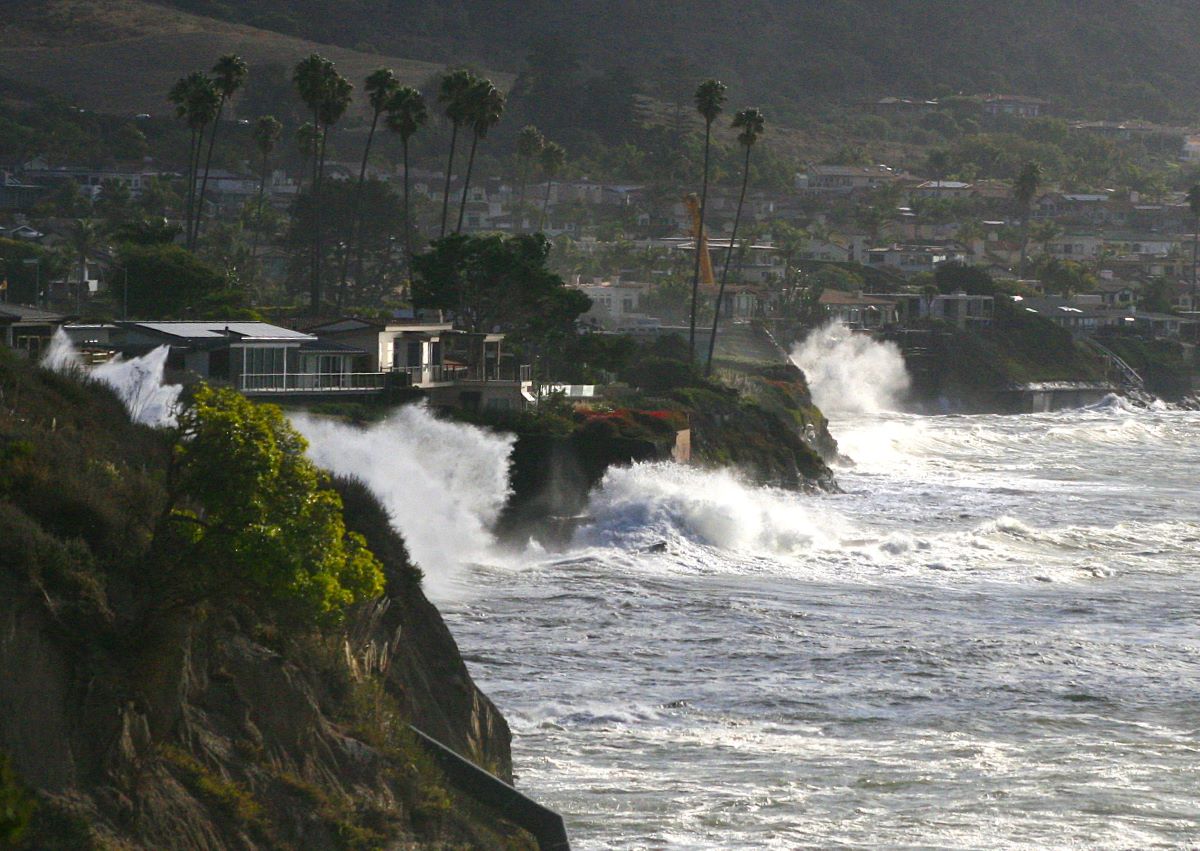
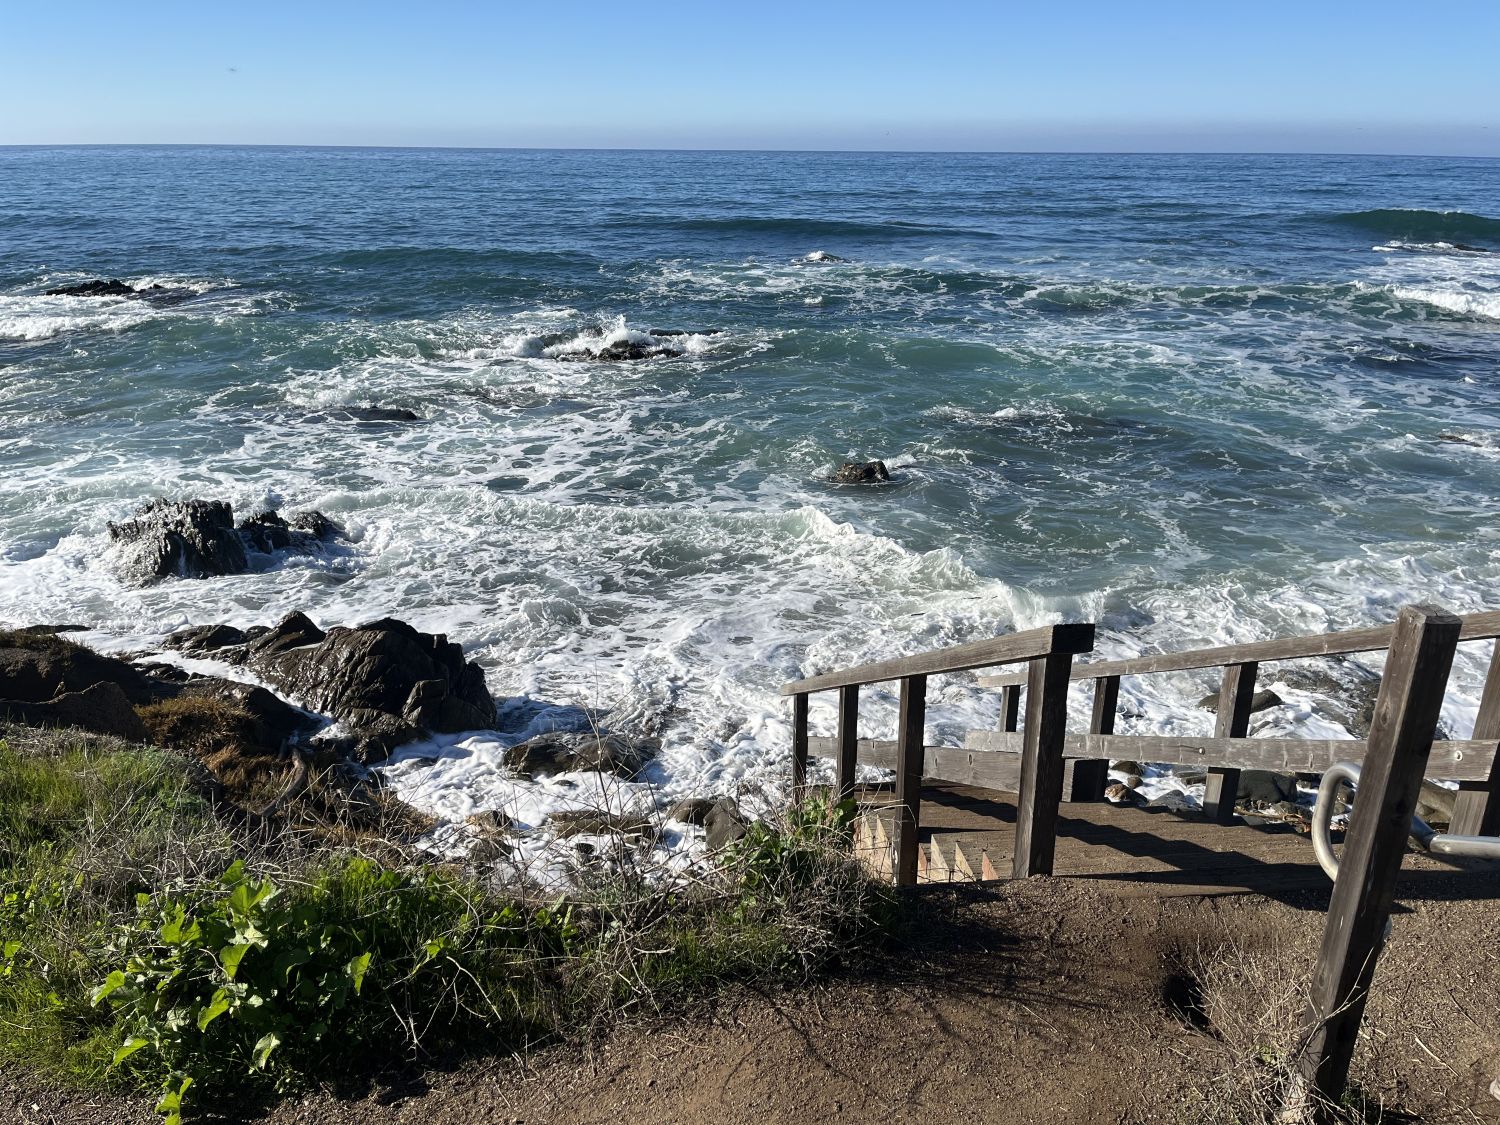
Bluffs Trail, Shell Beach, 11/15/2024

Sherwood and Harvey access, Cambria, 11/15/2024

Ebb Tide Park, Shell Beach, 12/14/2024

Dog Beach, Avila Beach, 11/16/2024
Leffingwell Landing, Cambria, 11/15/2024
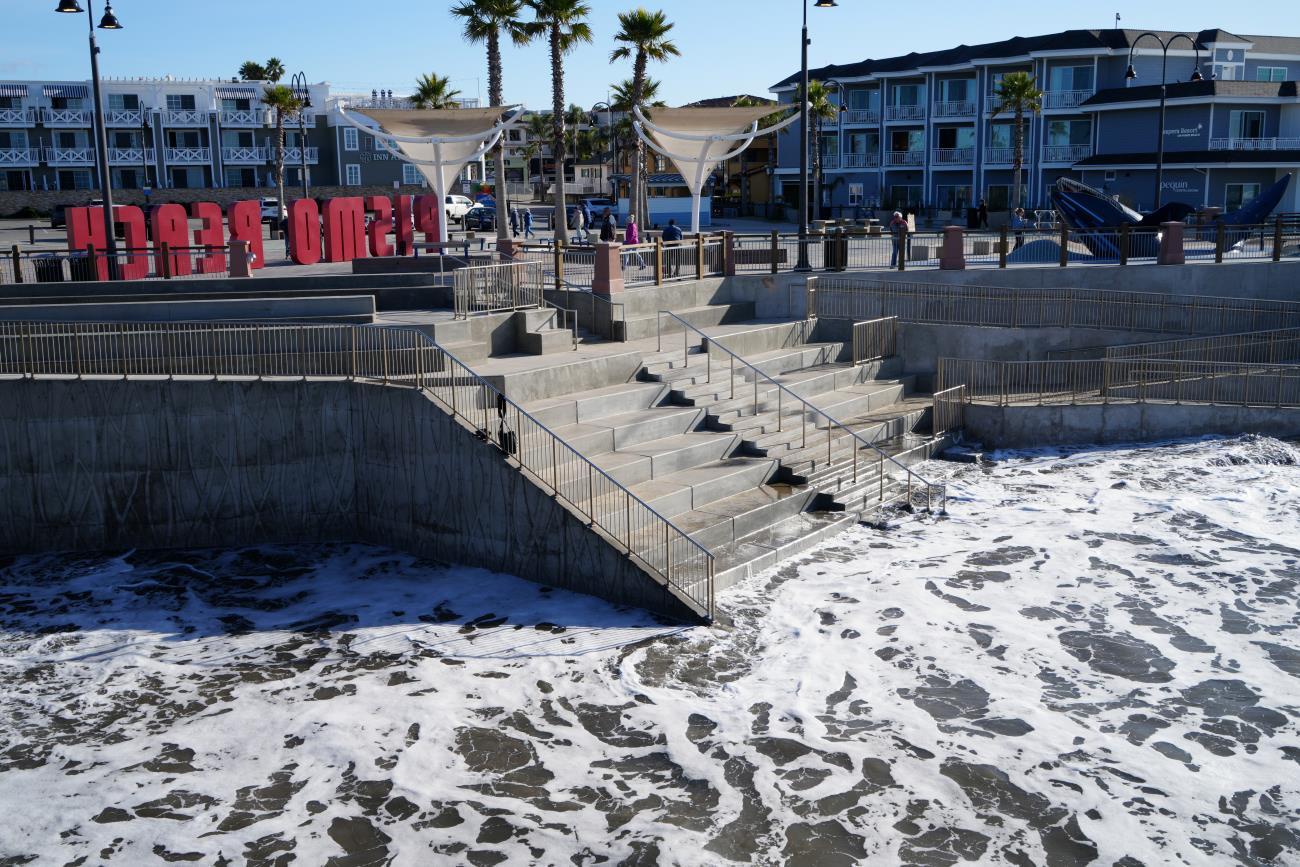
Pismo Beach, 2/9/2024
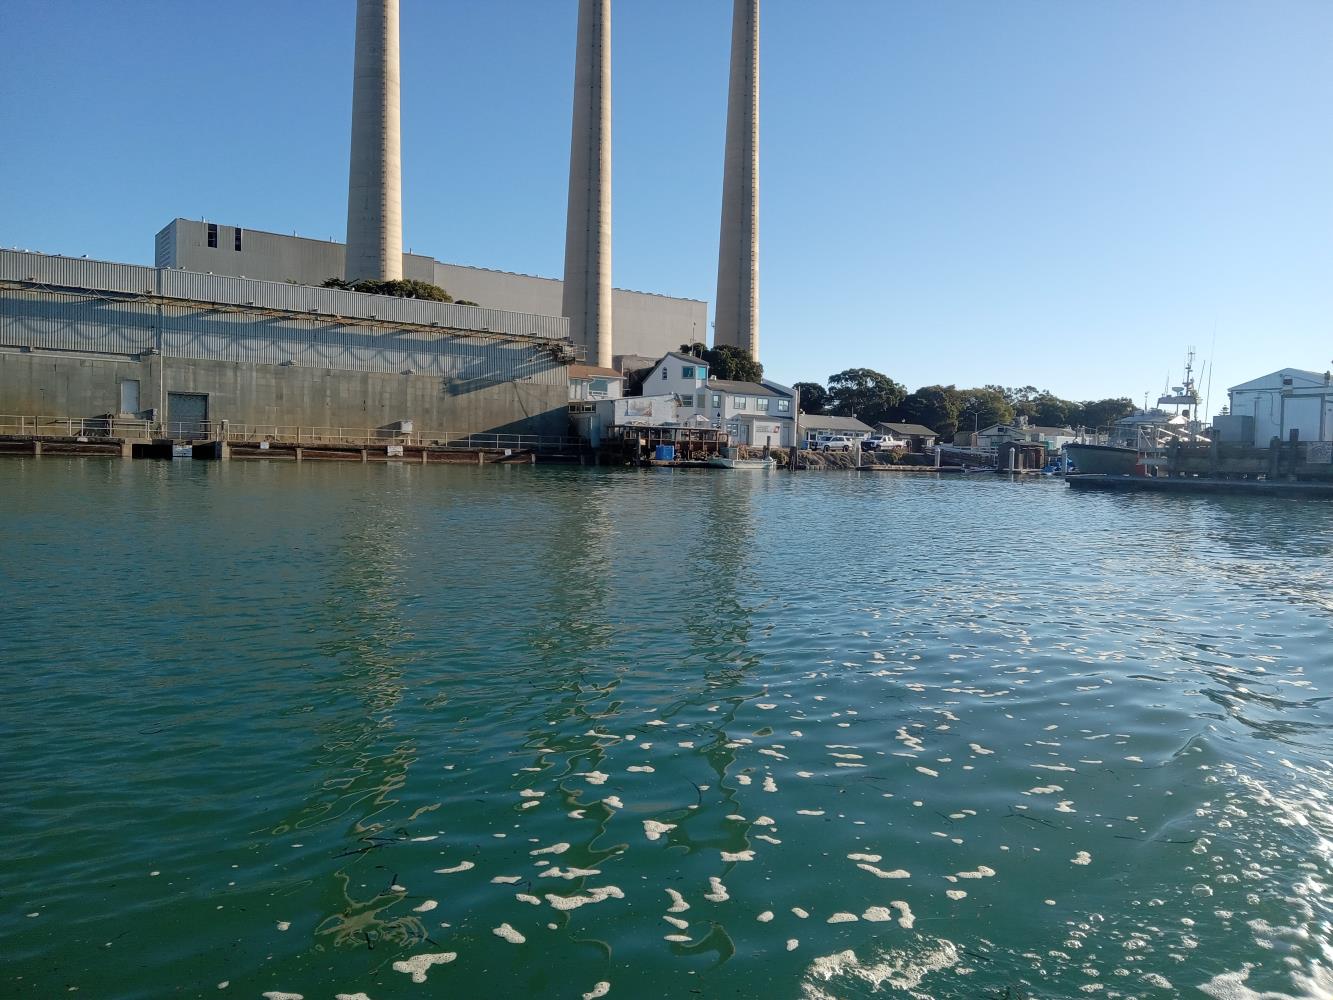
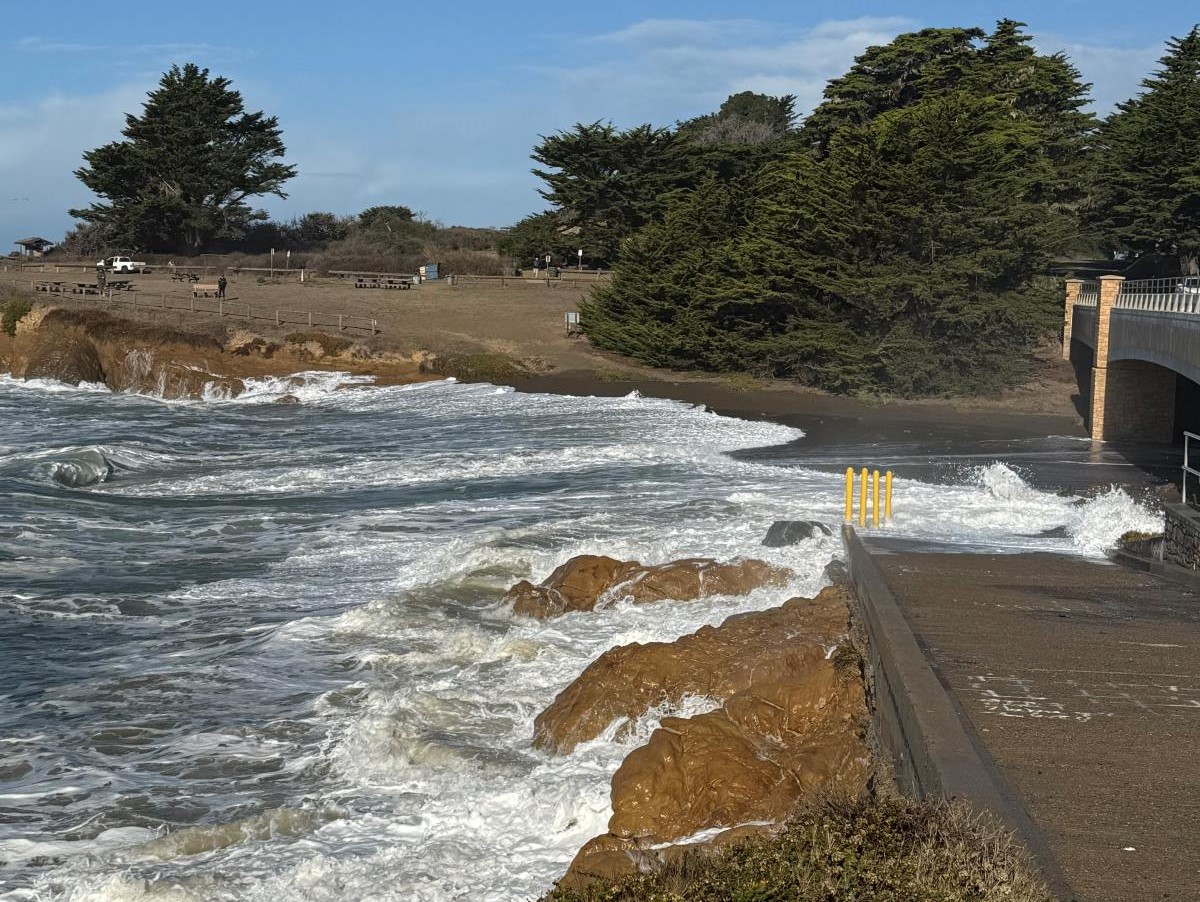
Morro Bay, 1/11/2024
Camino Del Sur beach, Isla Vista, 11/6/2025
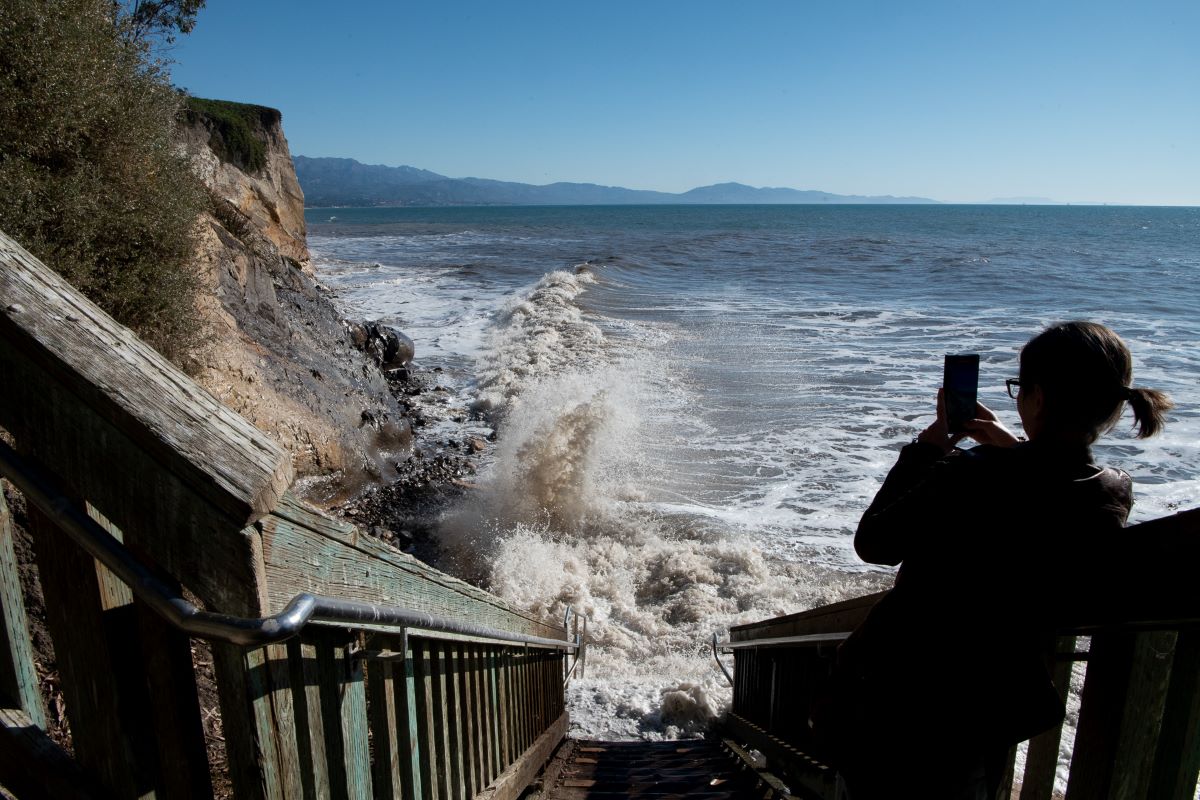
Mesa Lane Steps, Santa Barbara, 1/3/2026
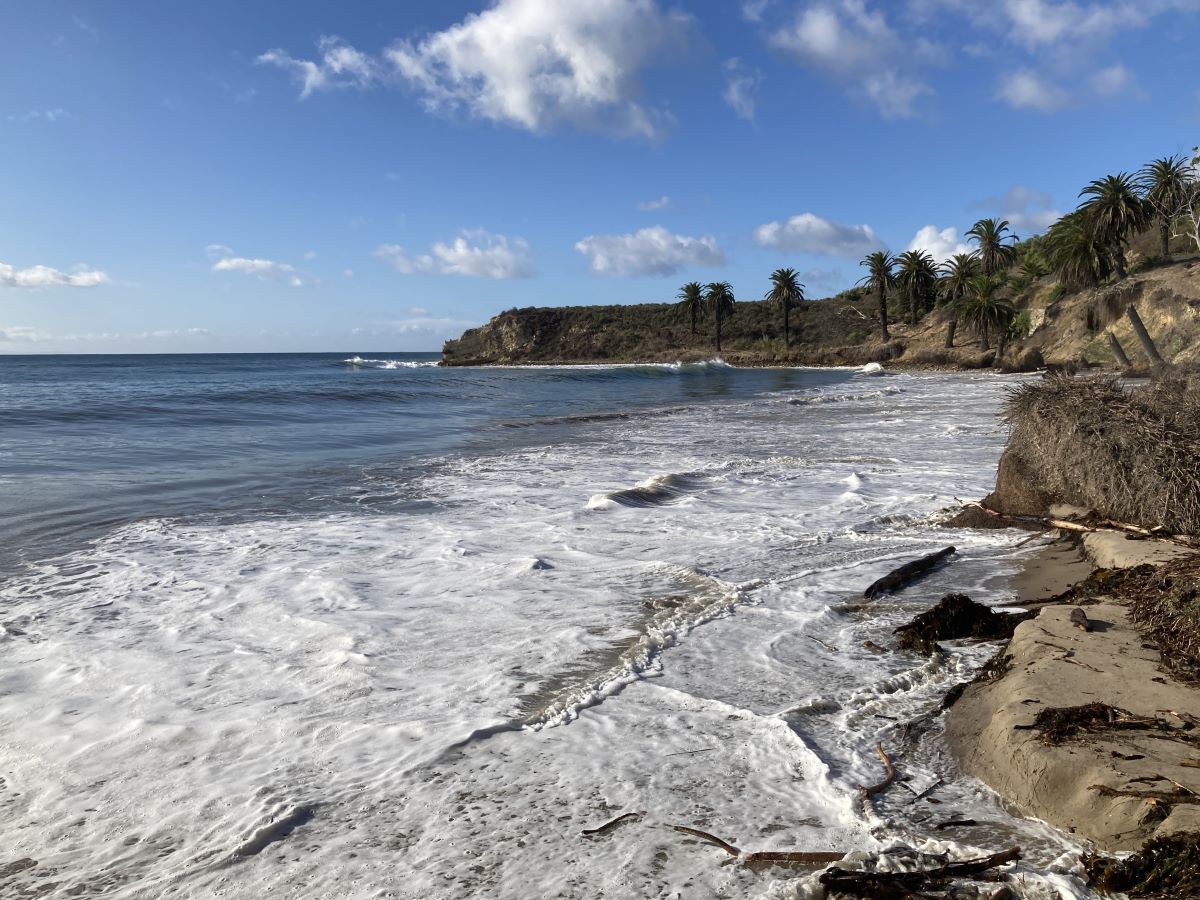
Butterfly Beach, Montecito, 11/6/2025
Campus Point, UC Santa Barbara, 11/6/2025
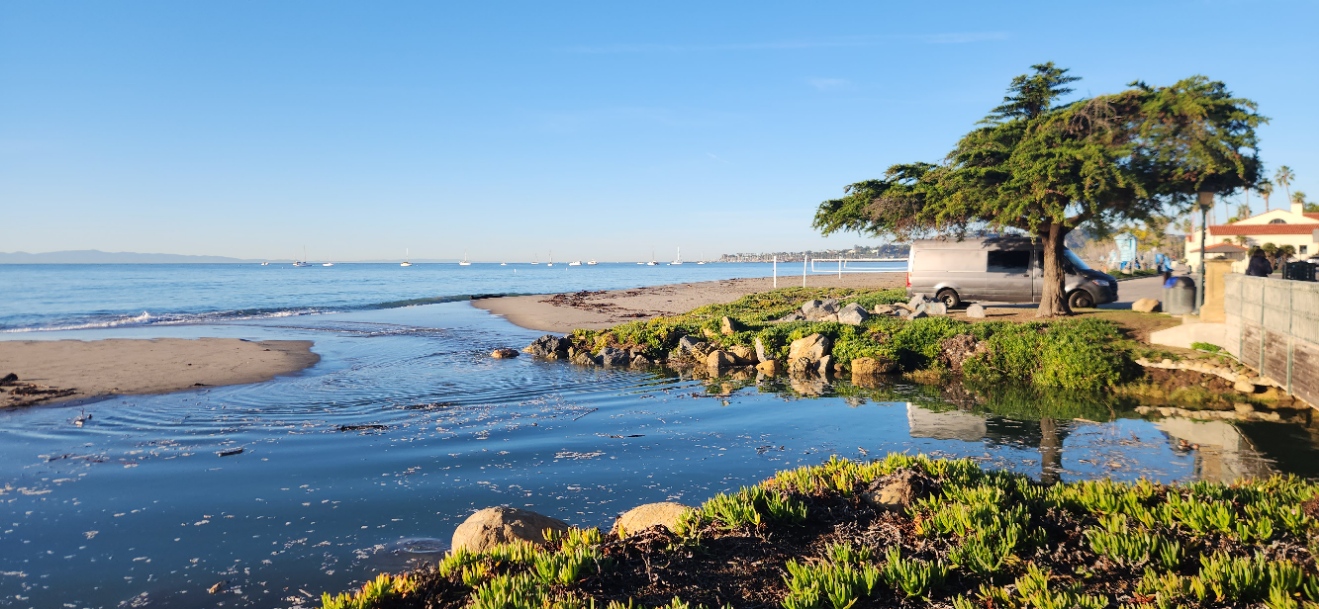
Sycamore Creek, Santa Barbara, 12/4/2025
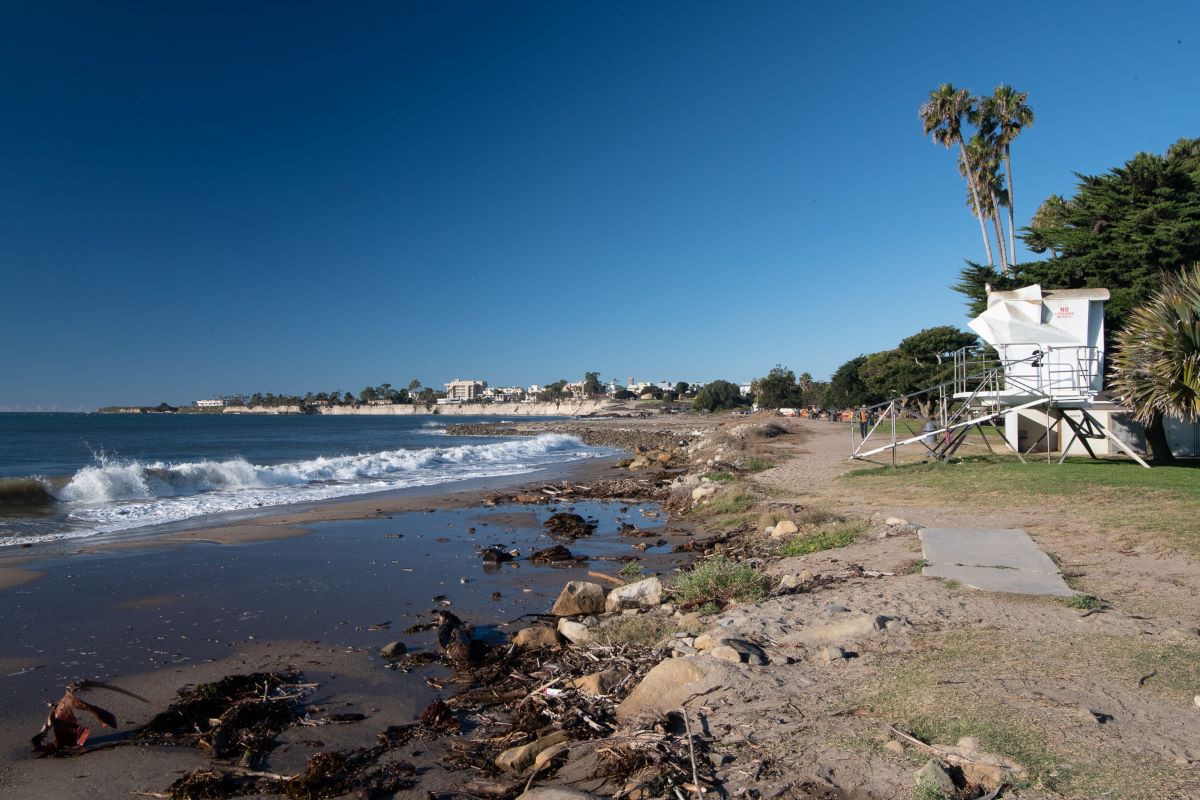
Leadbetter Beach, Santa Barbara, 11/16/2024

Hendry's Beach, Santa Barbara, 11/15/2024
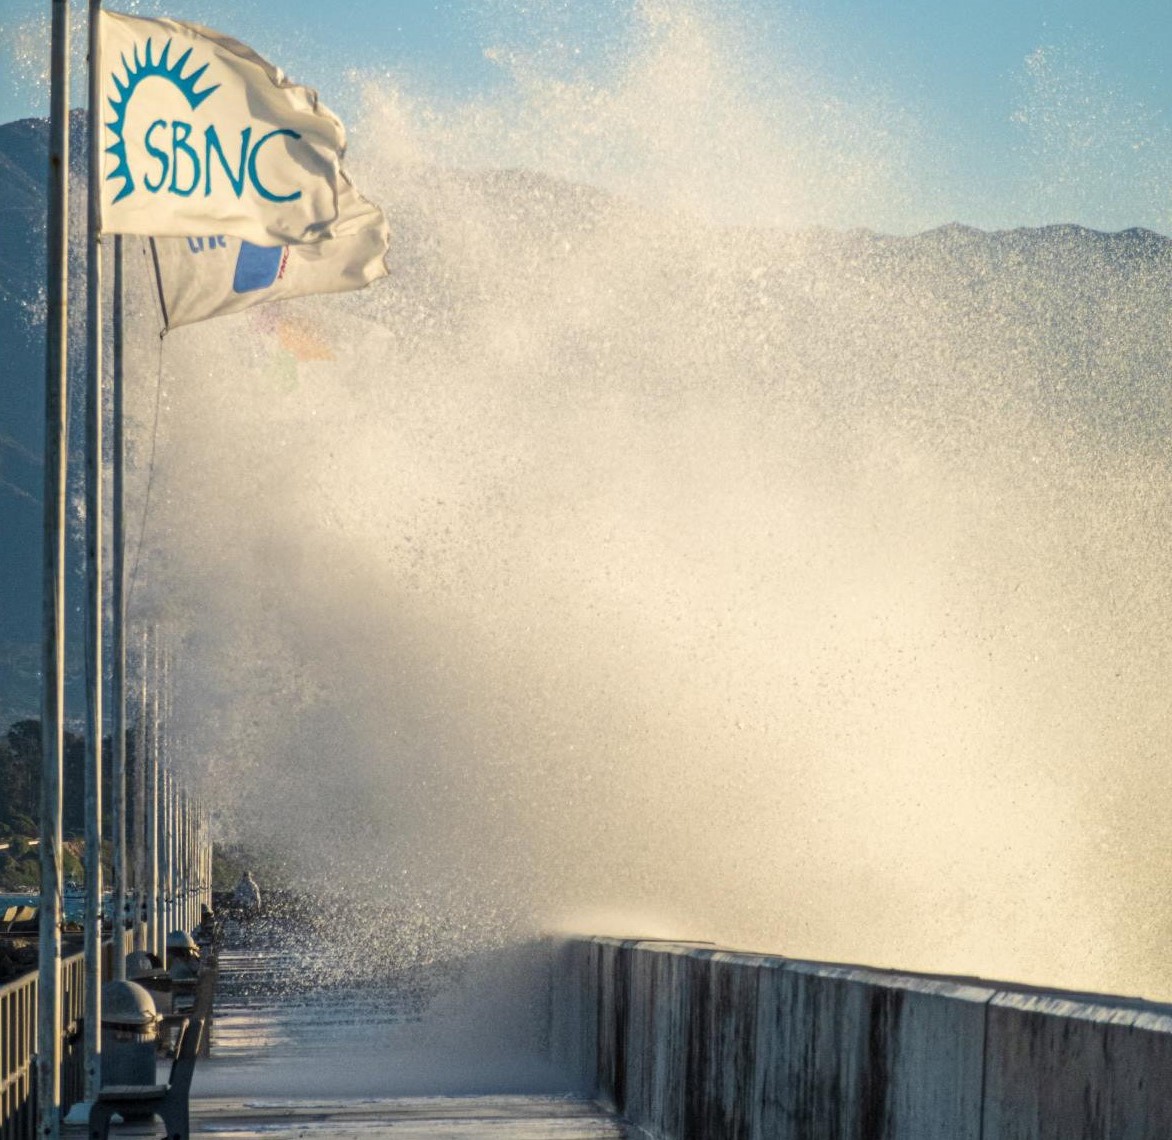
Santa Barbara Breakwater, 11/16/2024
Refugio State Beach, 11/15/2024
Goleta Beach, 11/16/2024
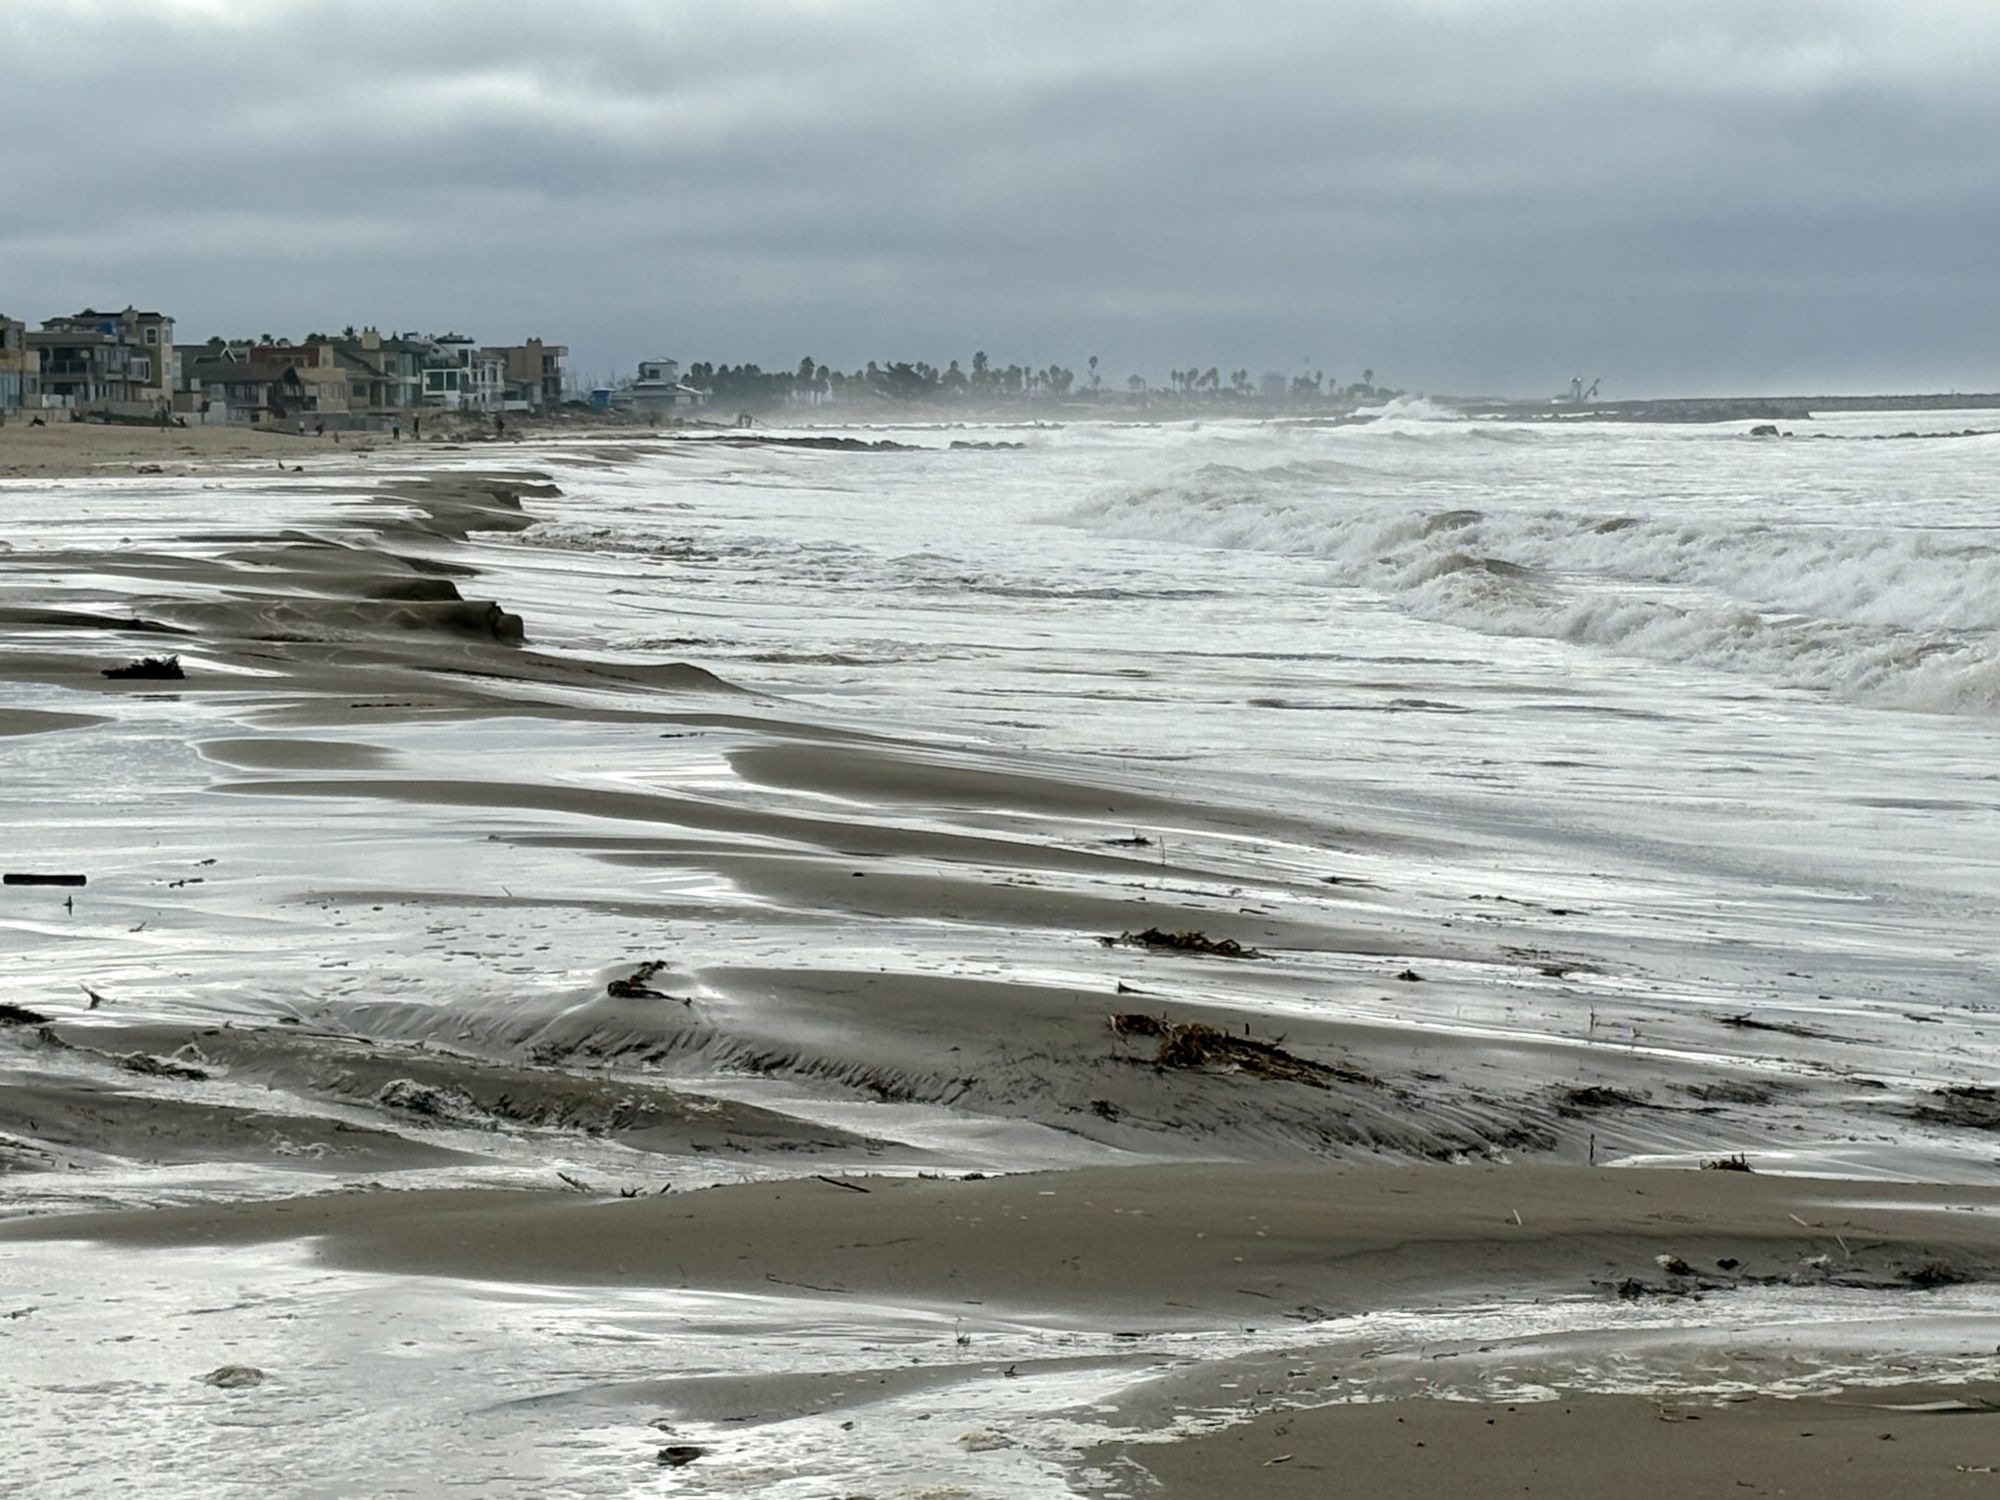
Pierpont Beach at Winthrop Lane, Ventura, 11/6/2025
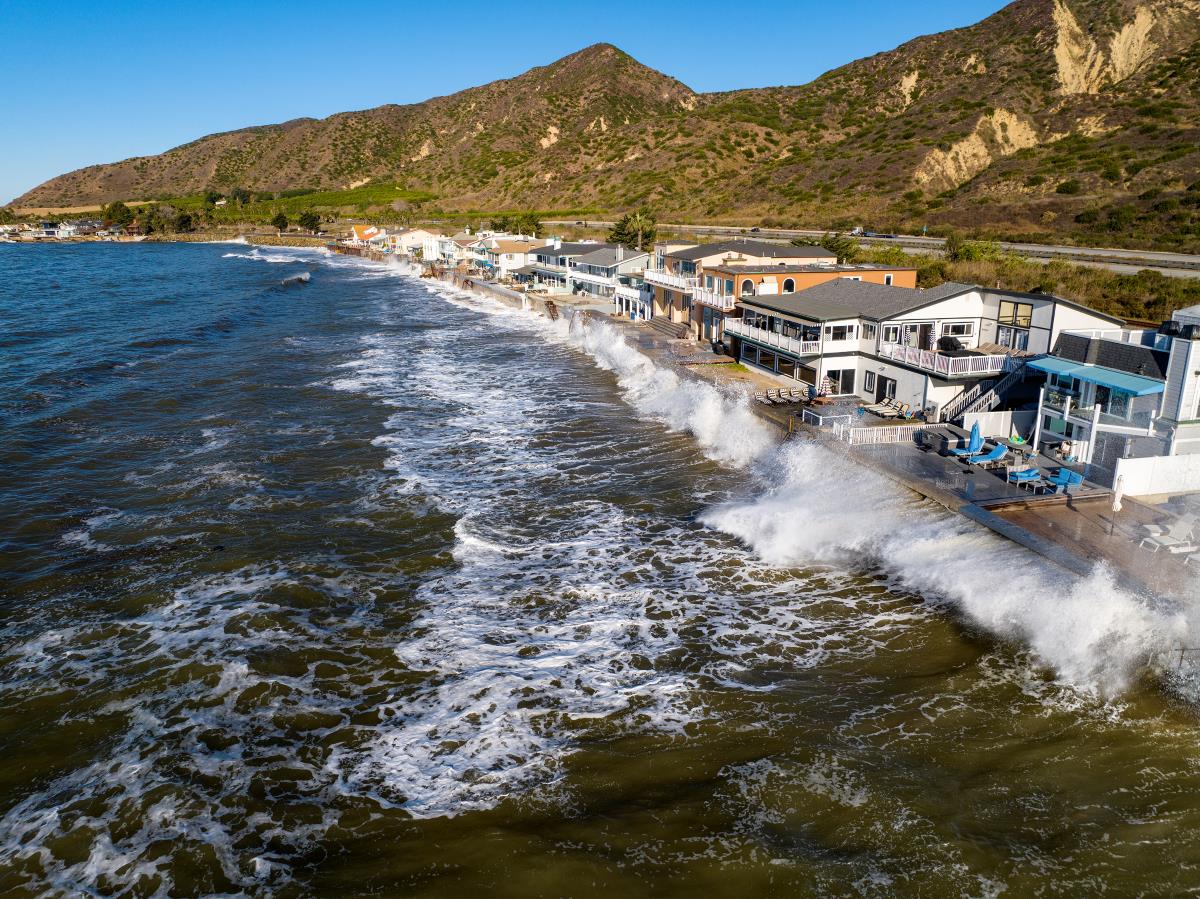
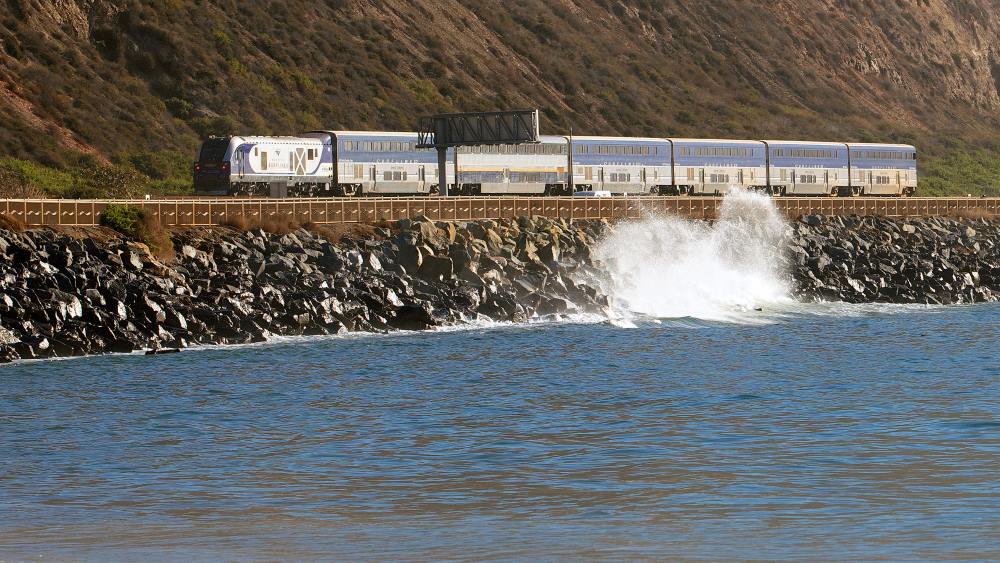
Mondos Cove Beach, 11/16/2024
Mondos Cove Beach, 11/16/2024
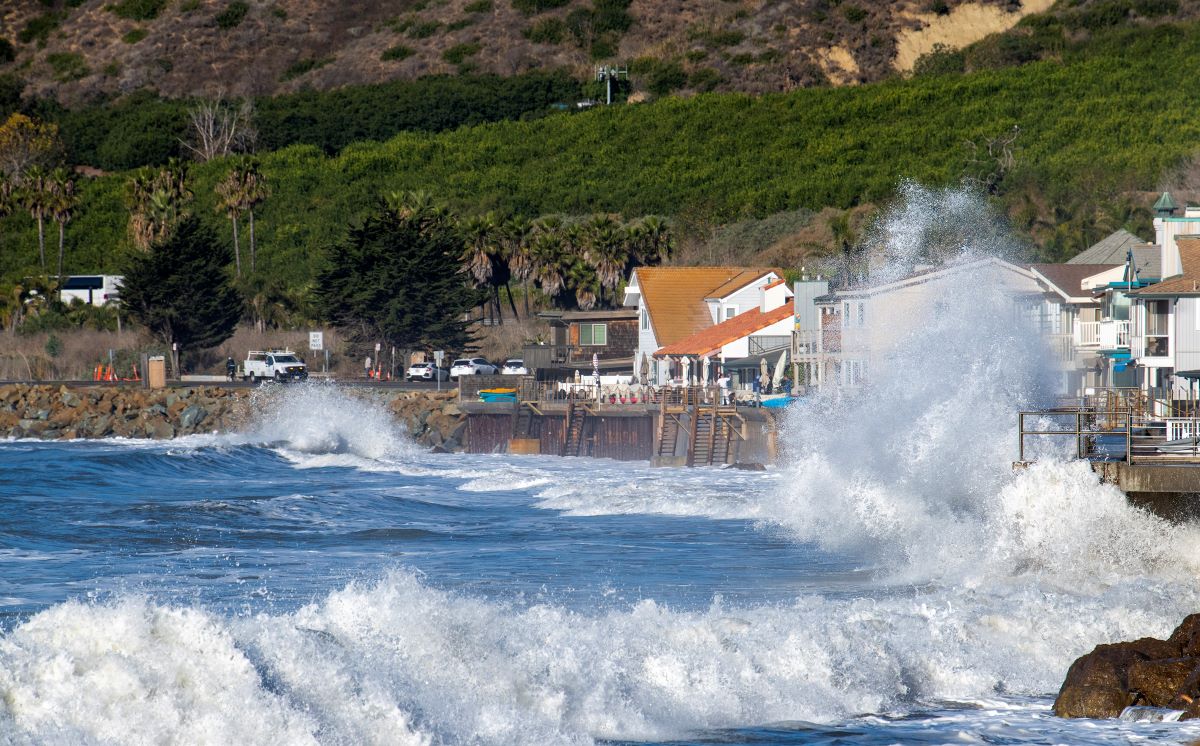
Pacific Coast Highway at Sycamore Cove Beach, 11/16/2024
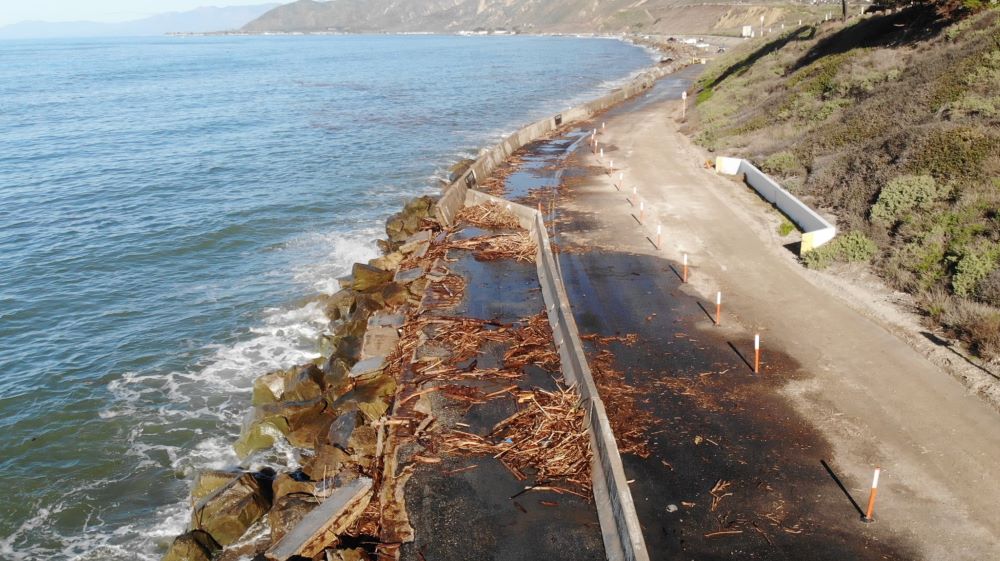
Emma Wood State Beach, Ventura, 1/22/2023
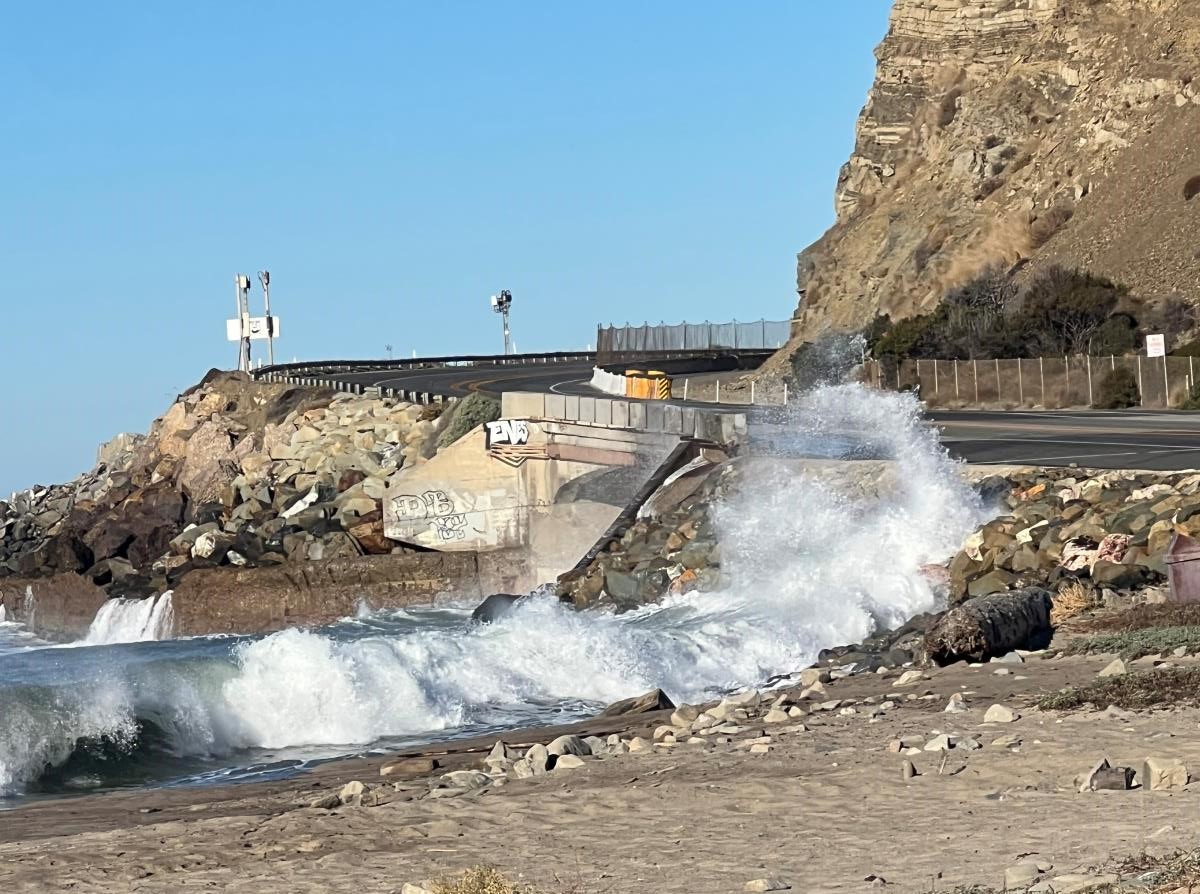
Rincon looking towards La Conchita, 12/2024/22
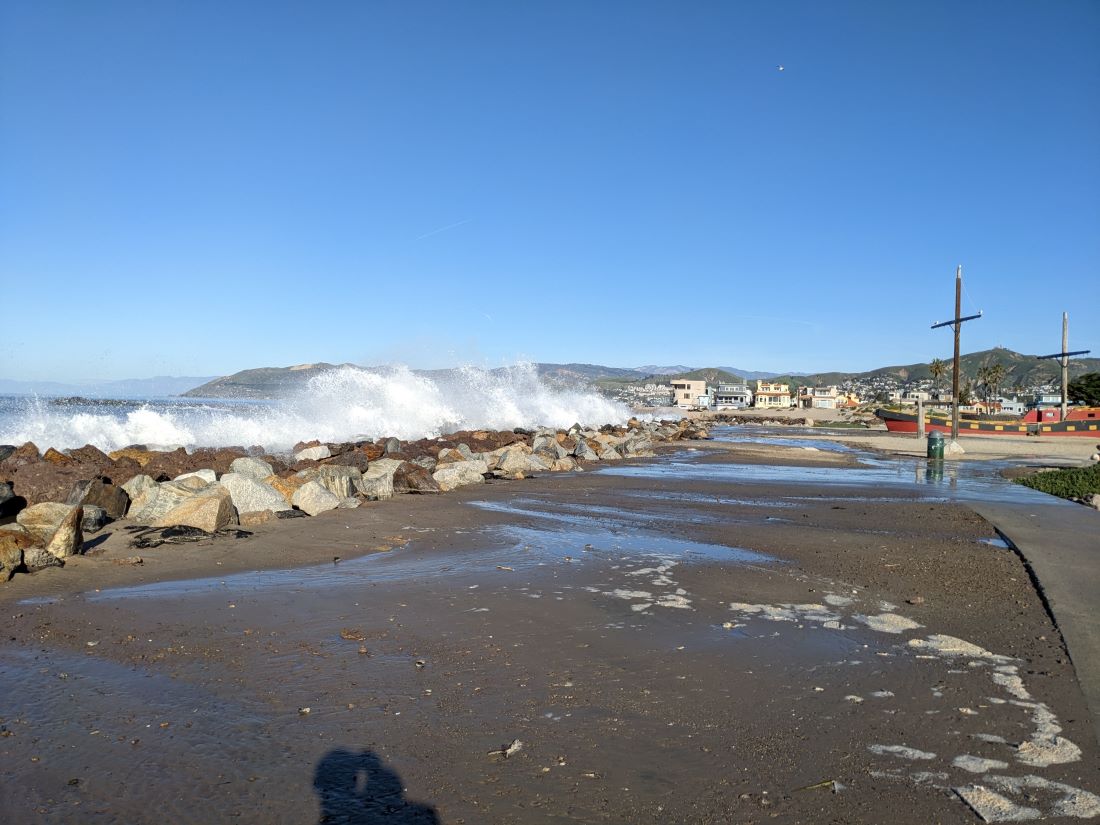
Marina Park, Ventura, 1/22/2023
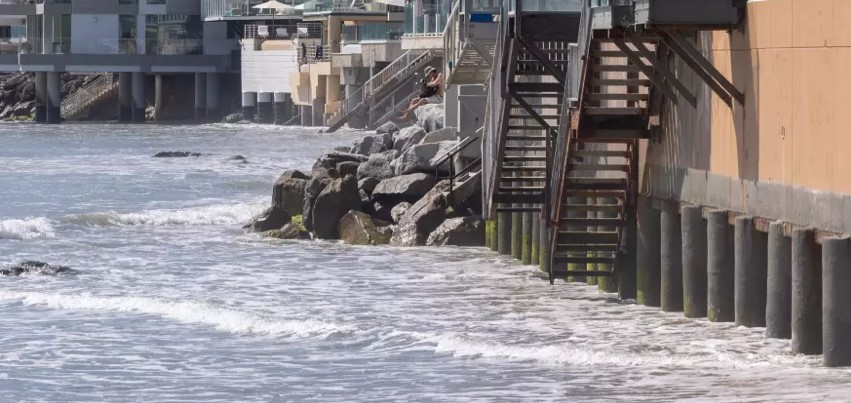
Pacific Coast Highway, Malibu, 12/6/2025
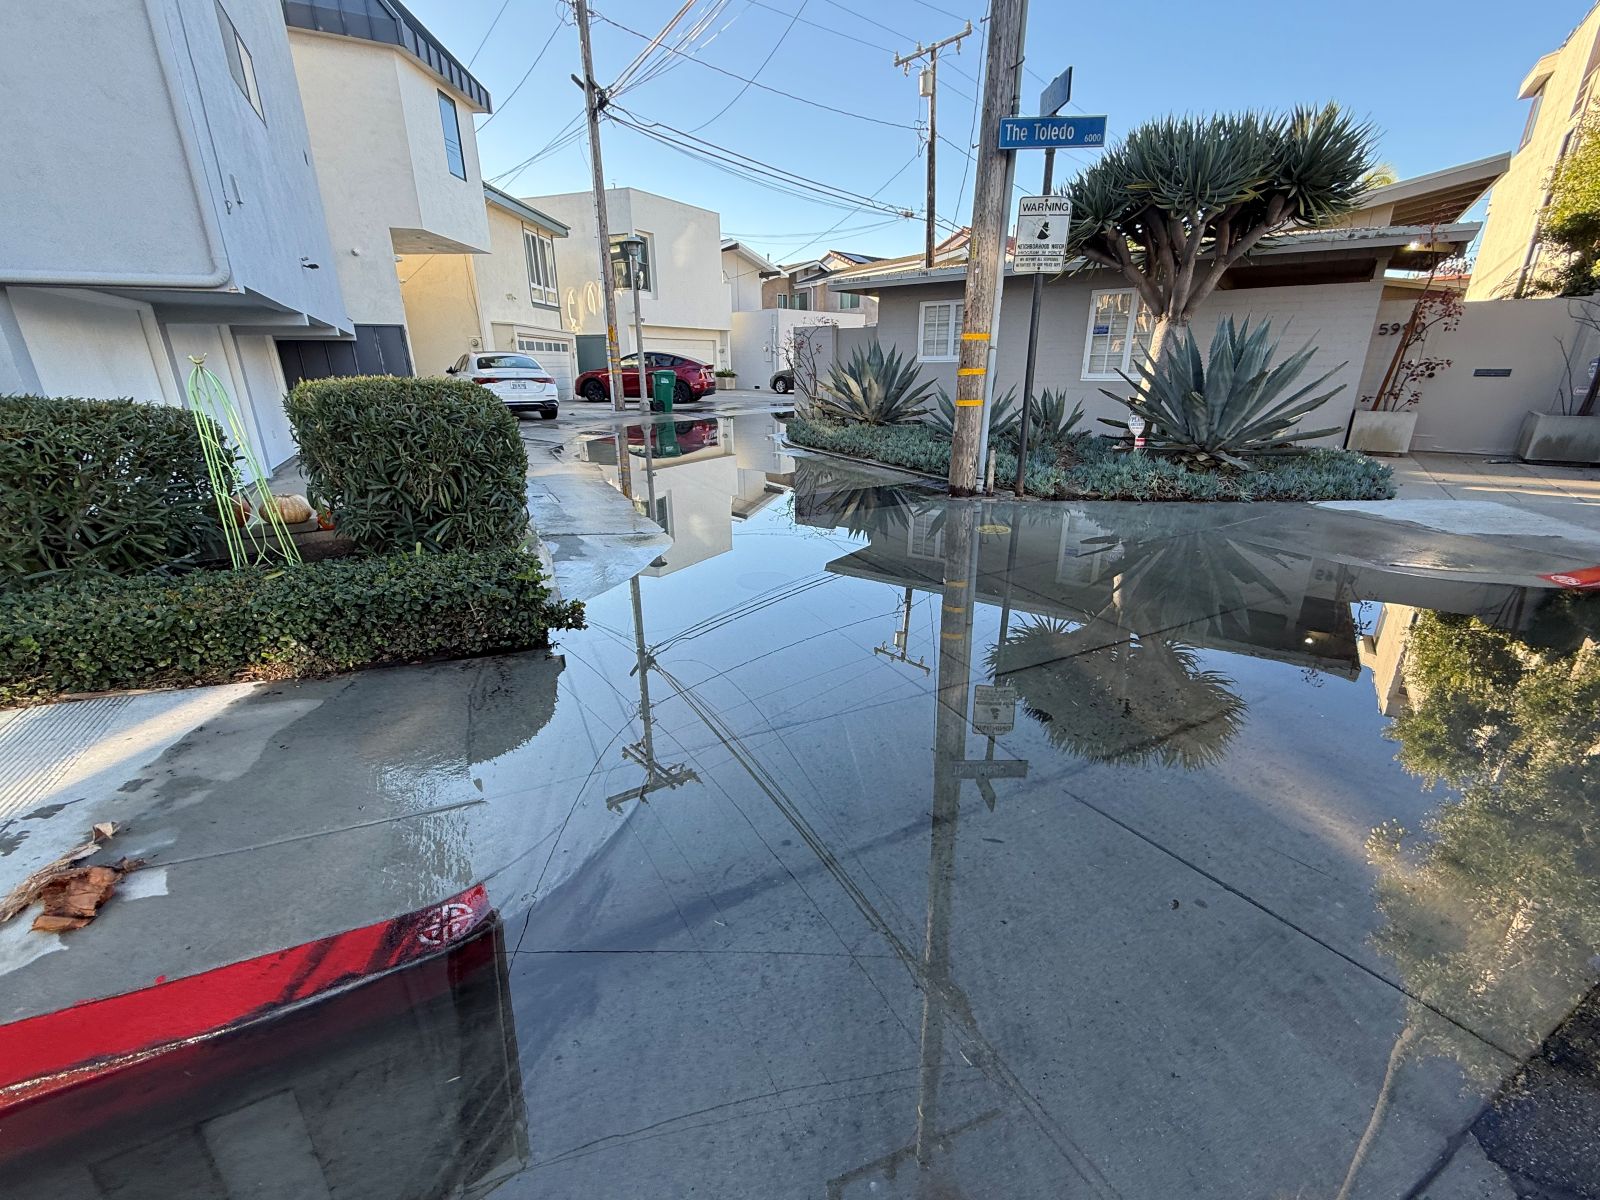
E. The Toledo and E. Lido Lane, Long Beach, 12/4/2025
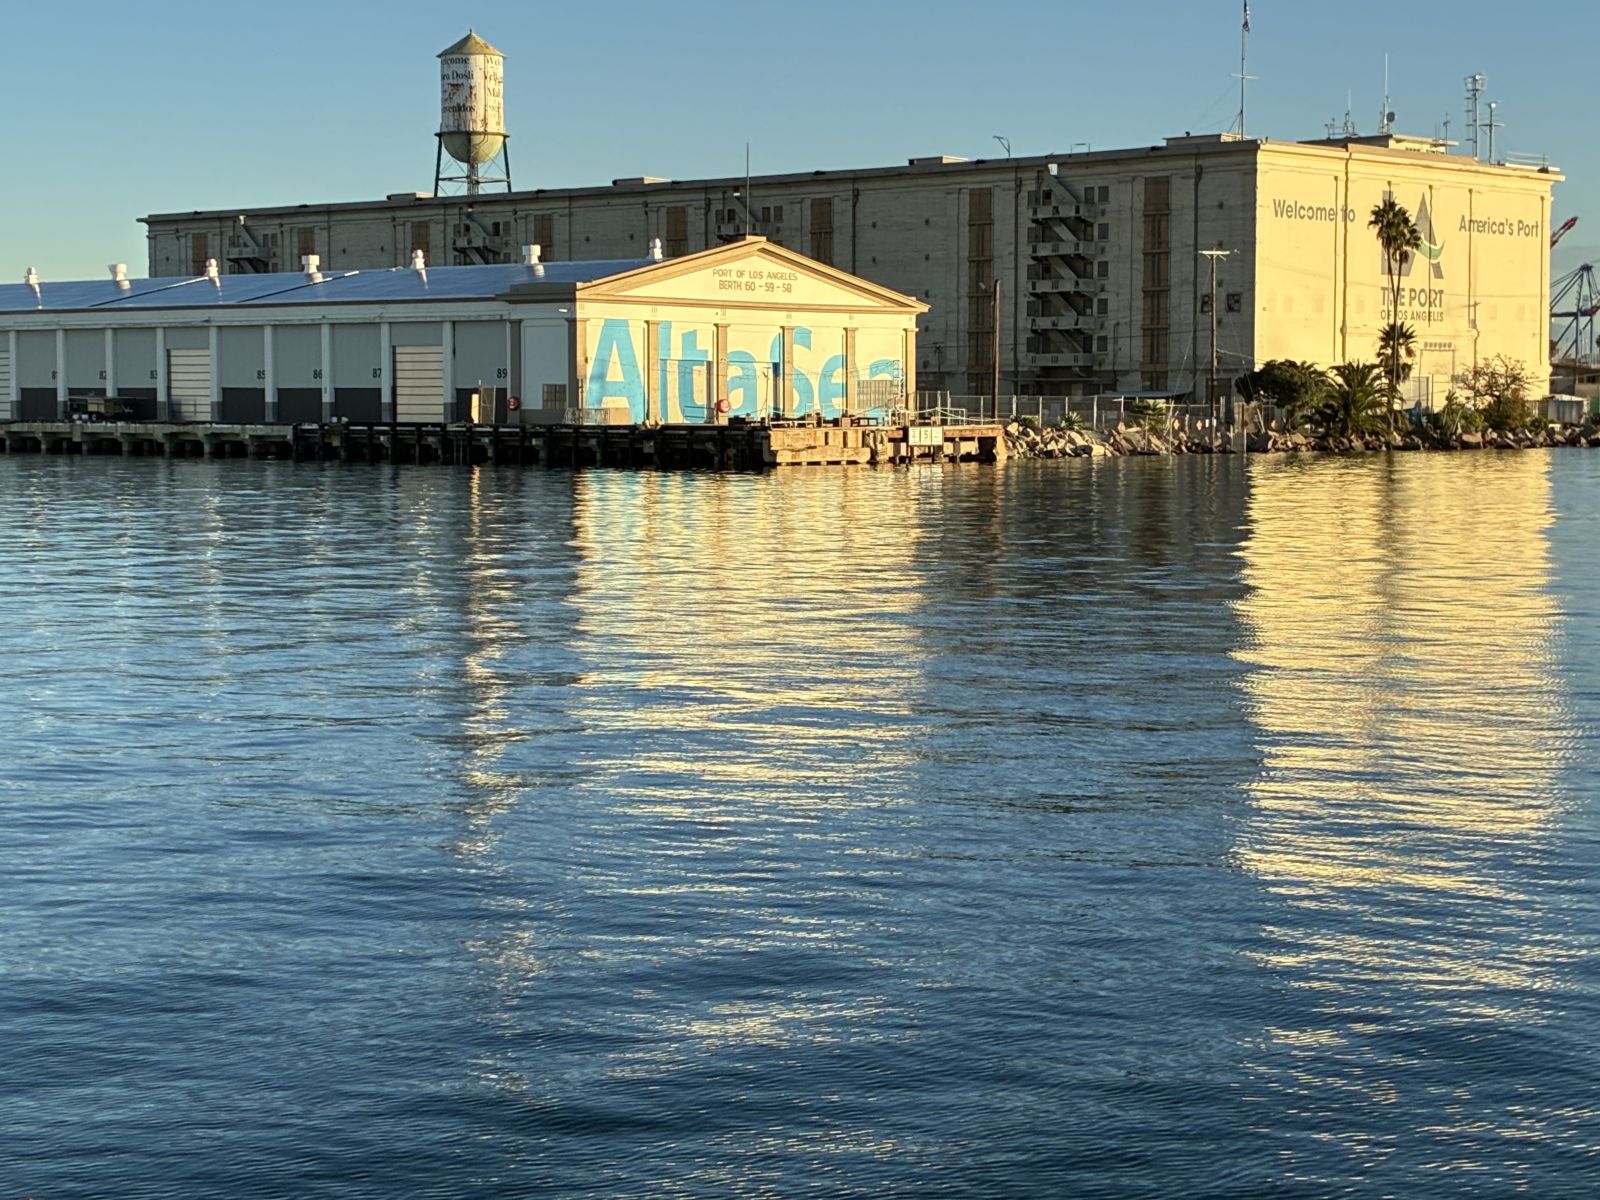
Alta Sea and Warehouse 1, Port of Los Angeles, 12/4/2025
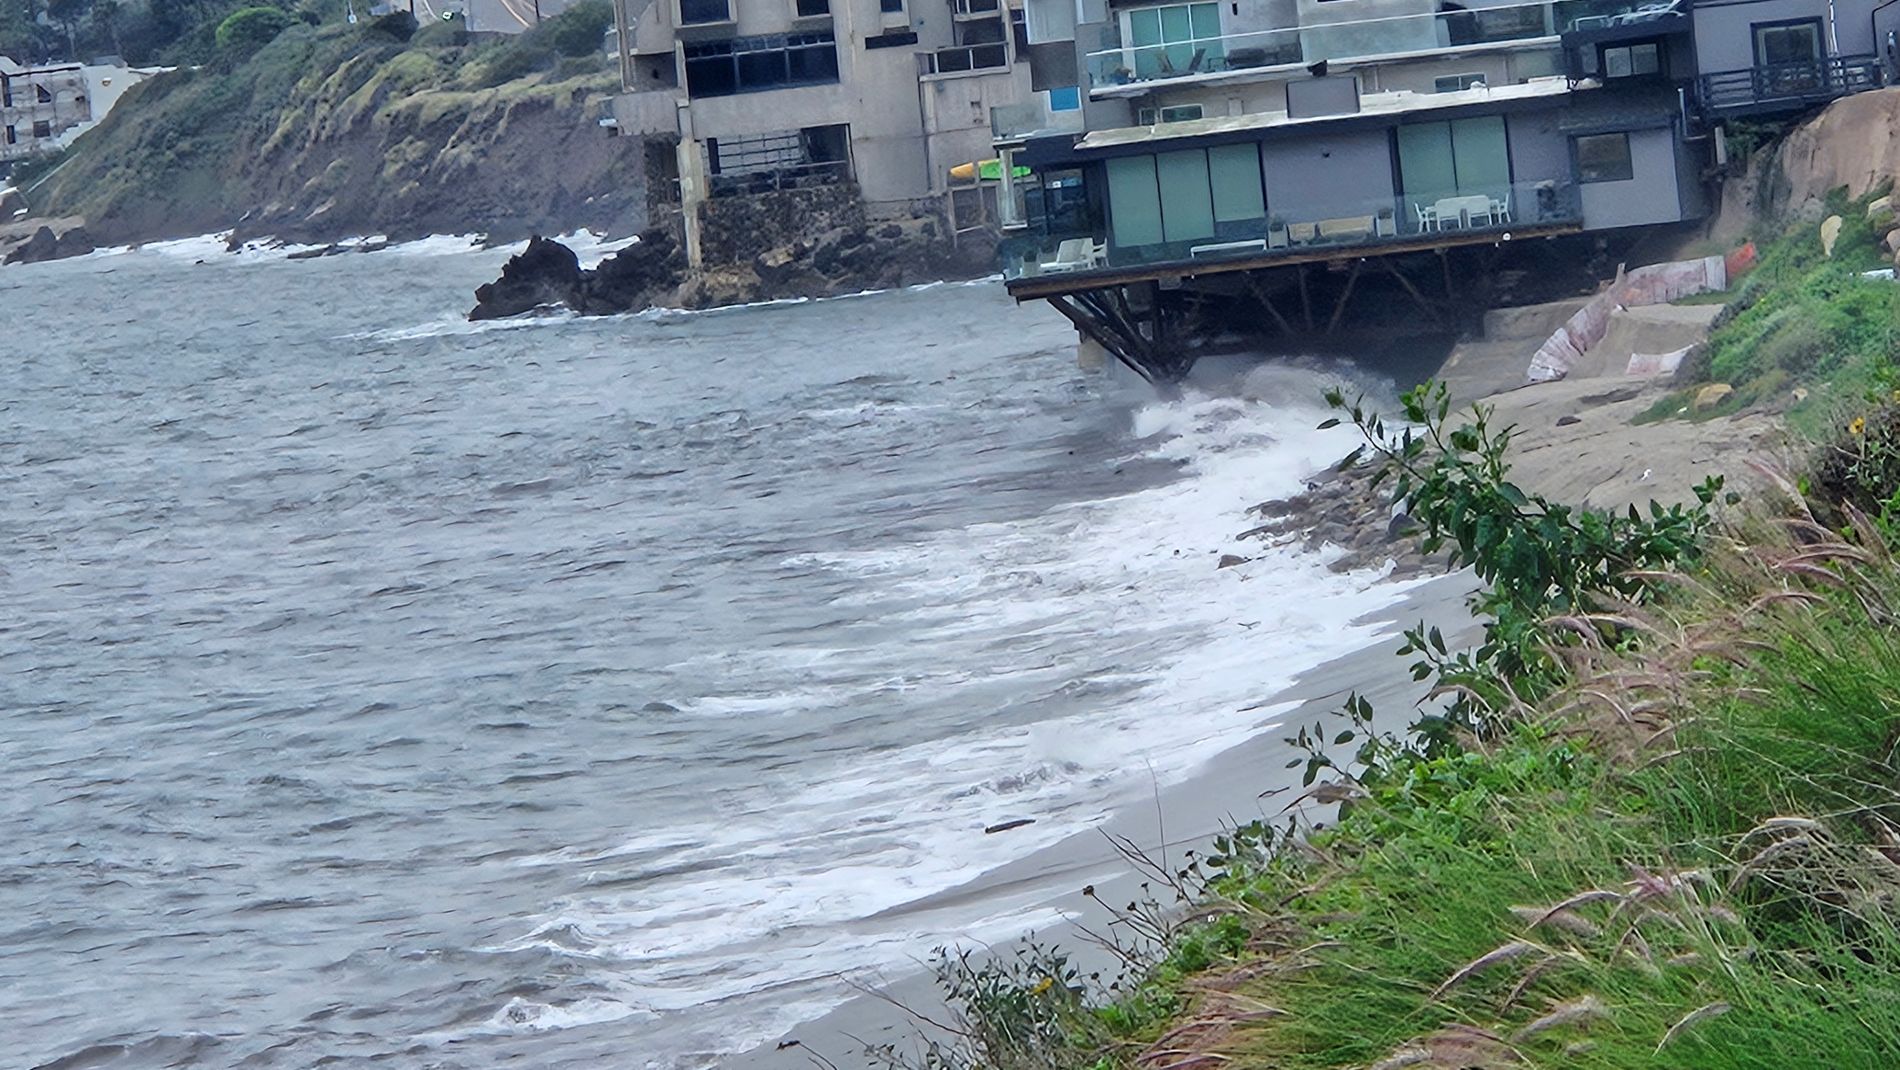
Pacific Coast Highway across from Surf Outpost Market, Malibu, 1/3/2026
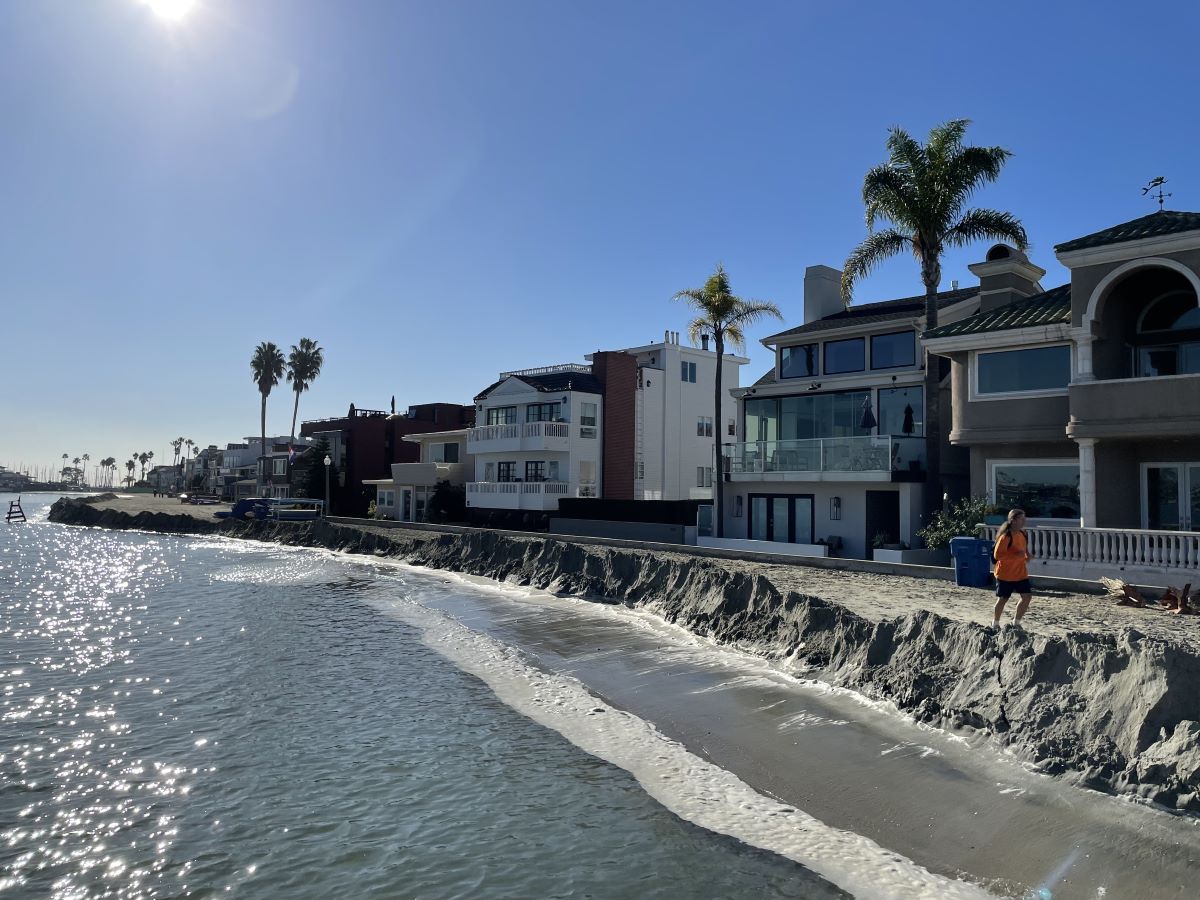
On the Peninsula near US Sailing Center, Long Beach, 12/4/2025
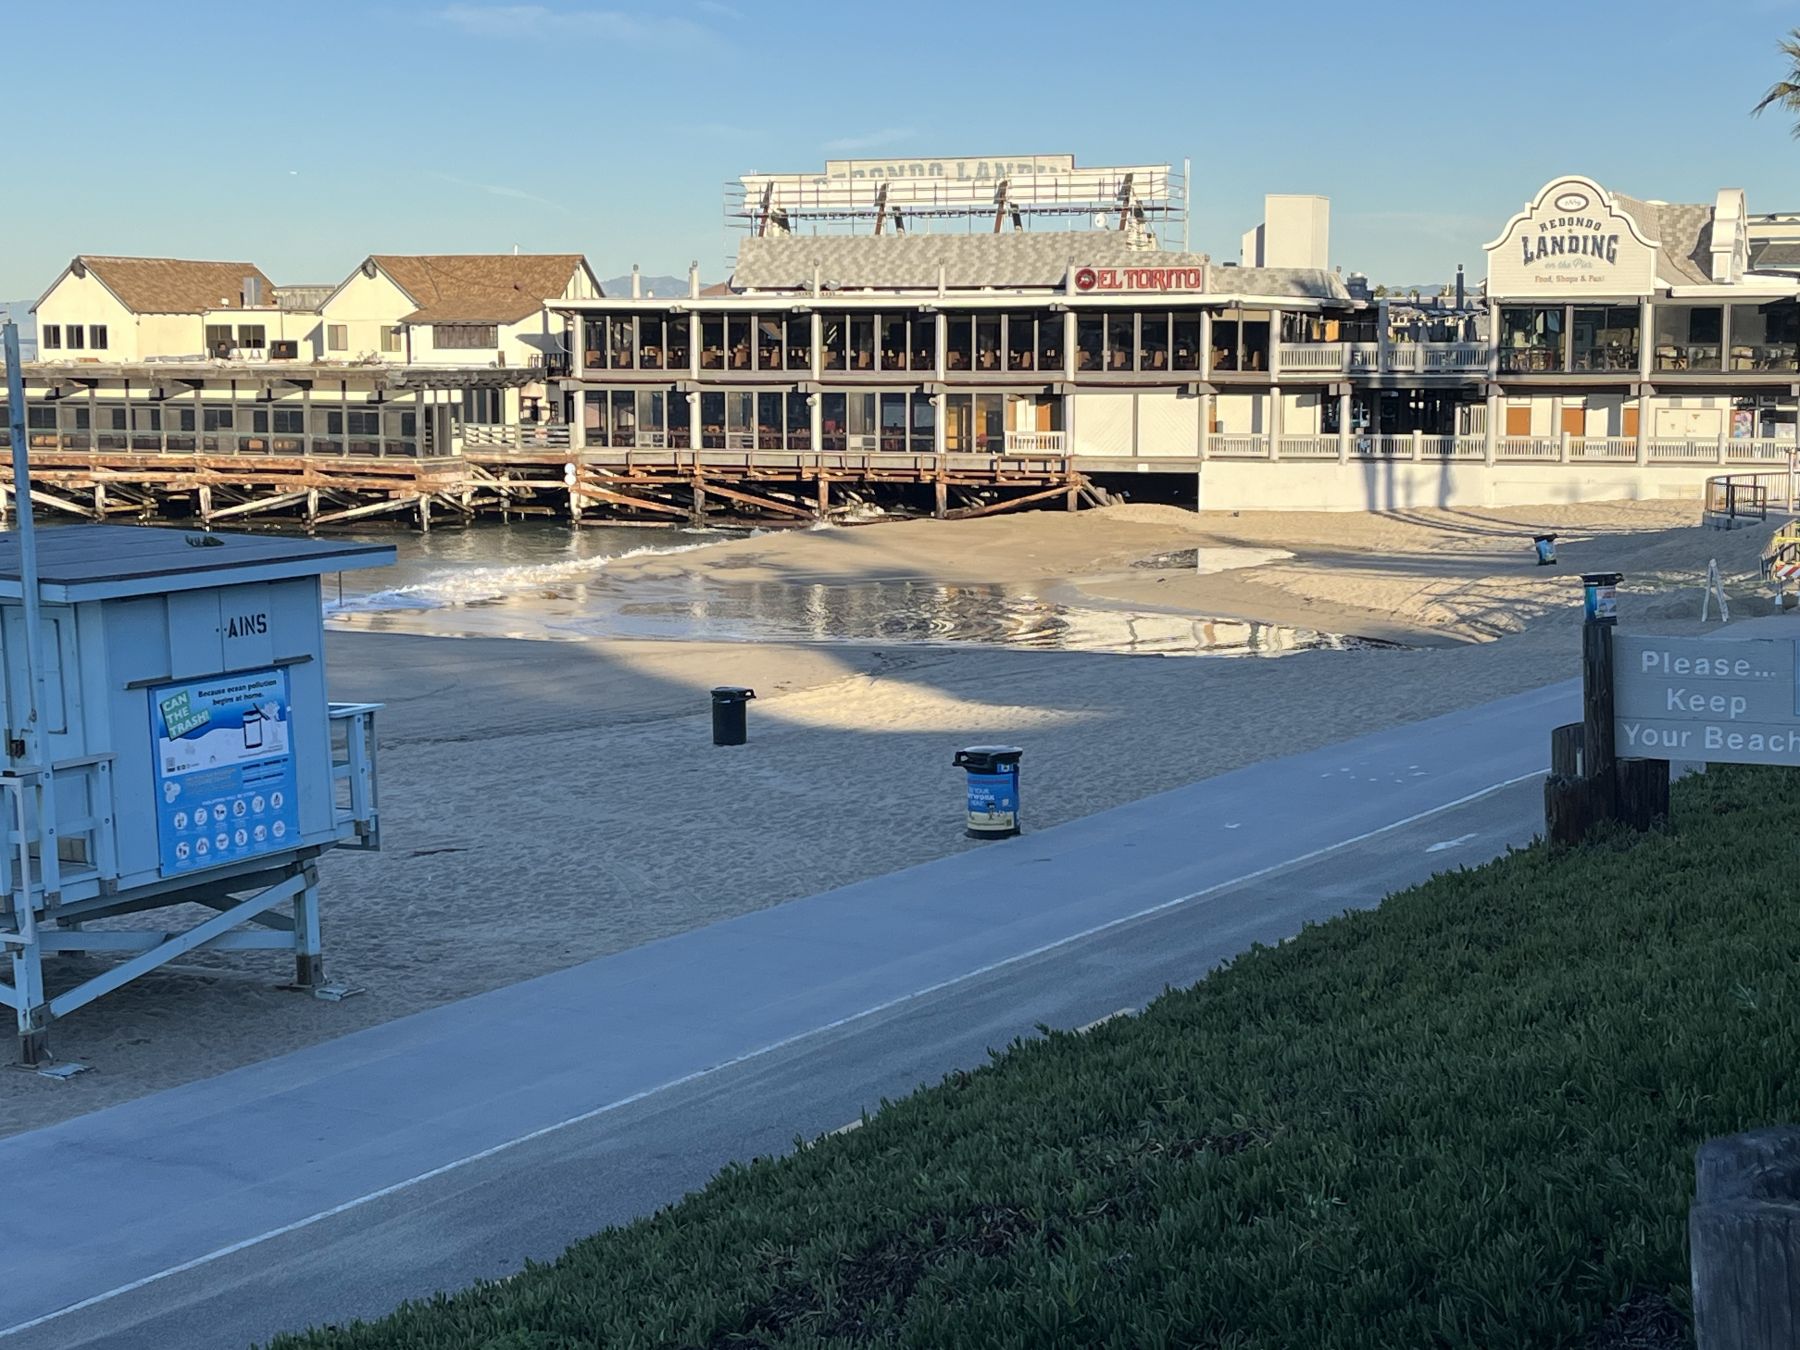
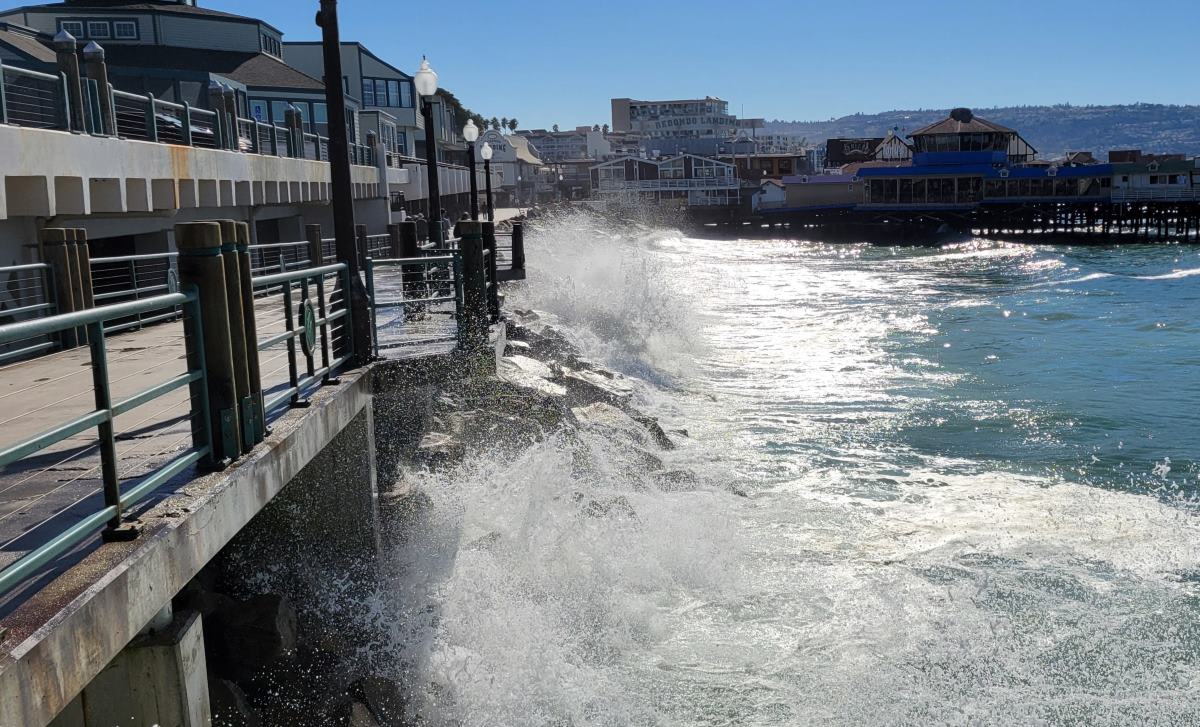
Redondo Pier, Redondo Beach, 12/4/2025
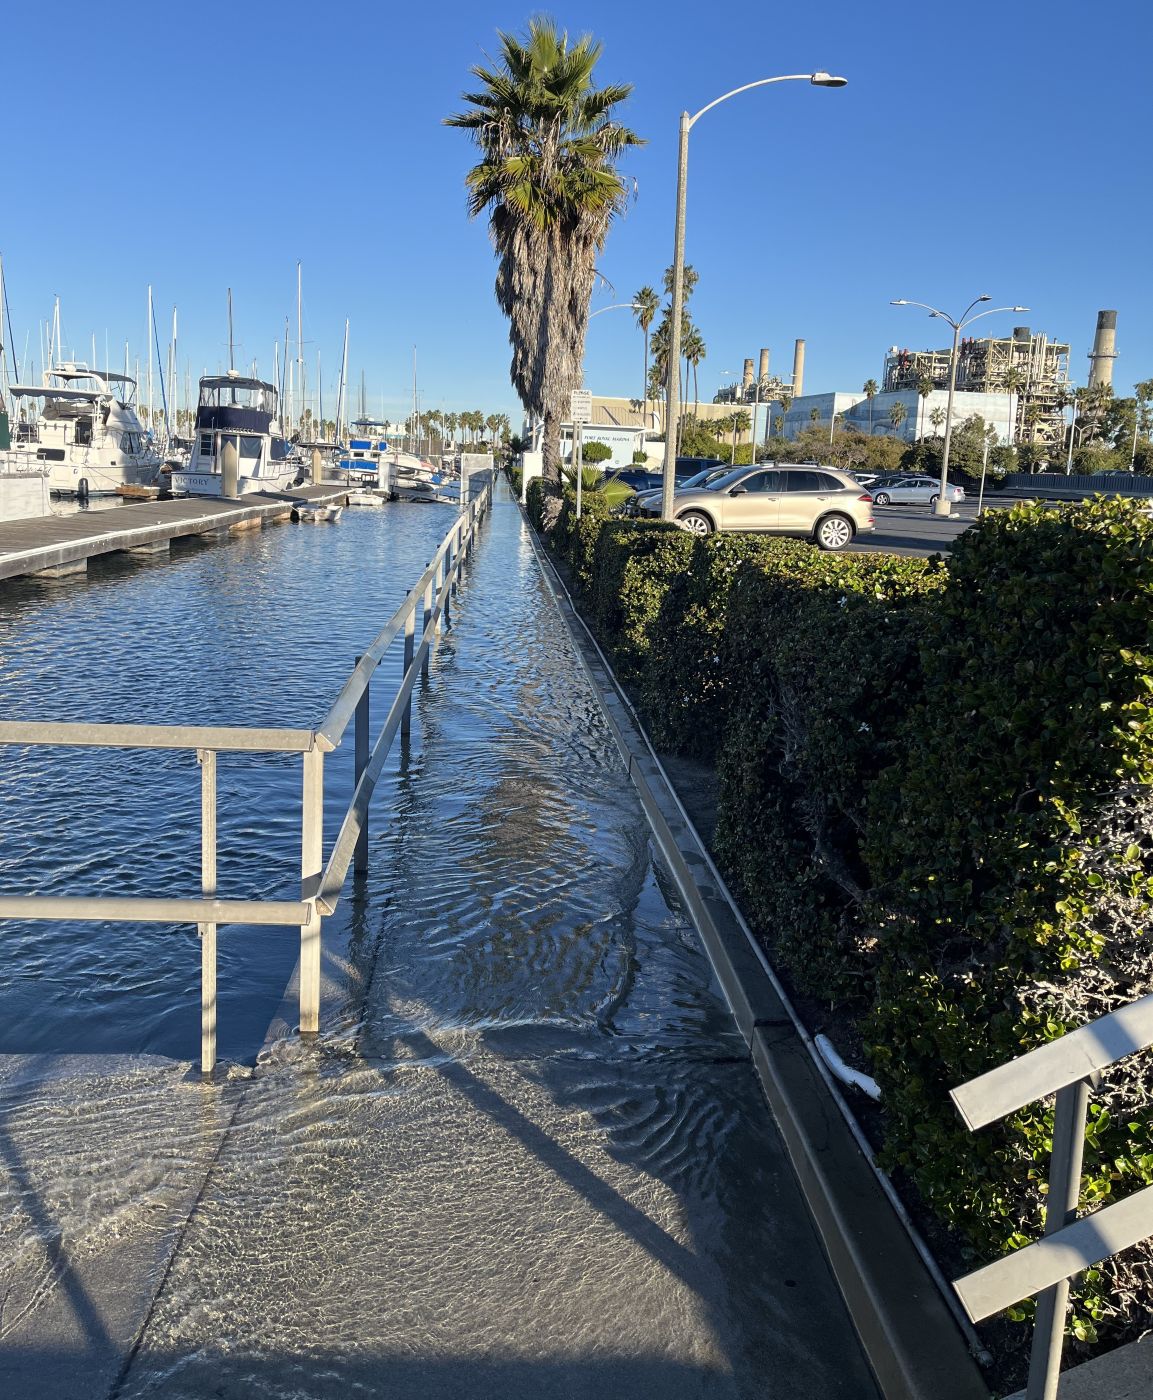
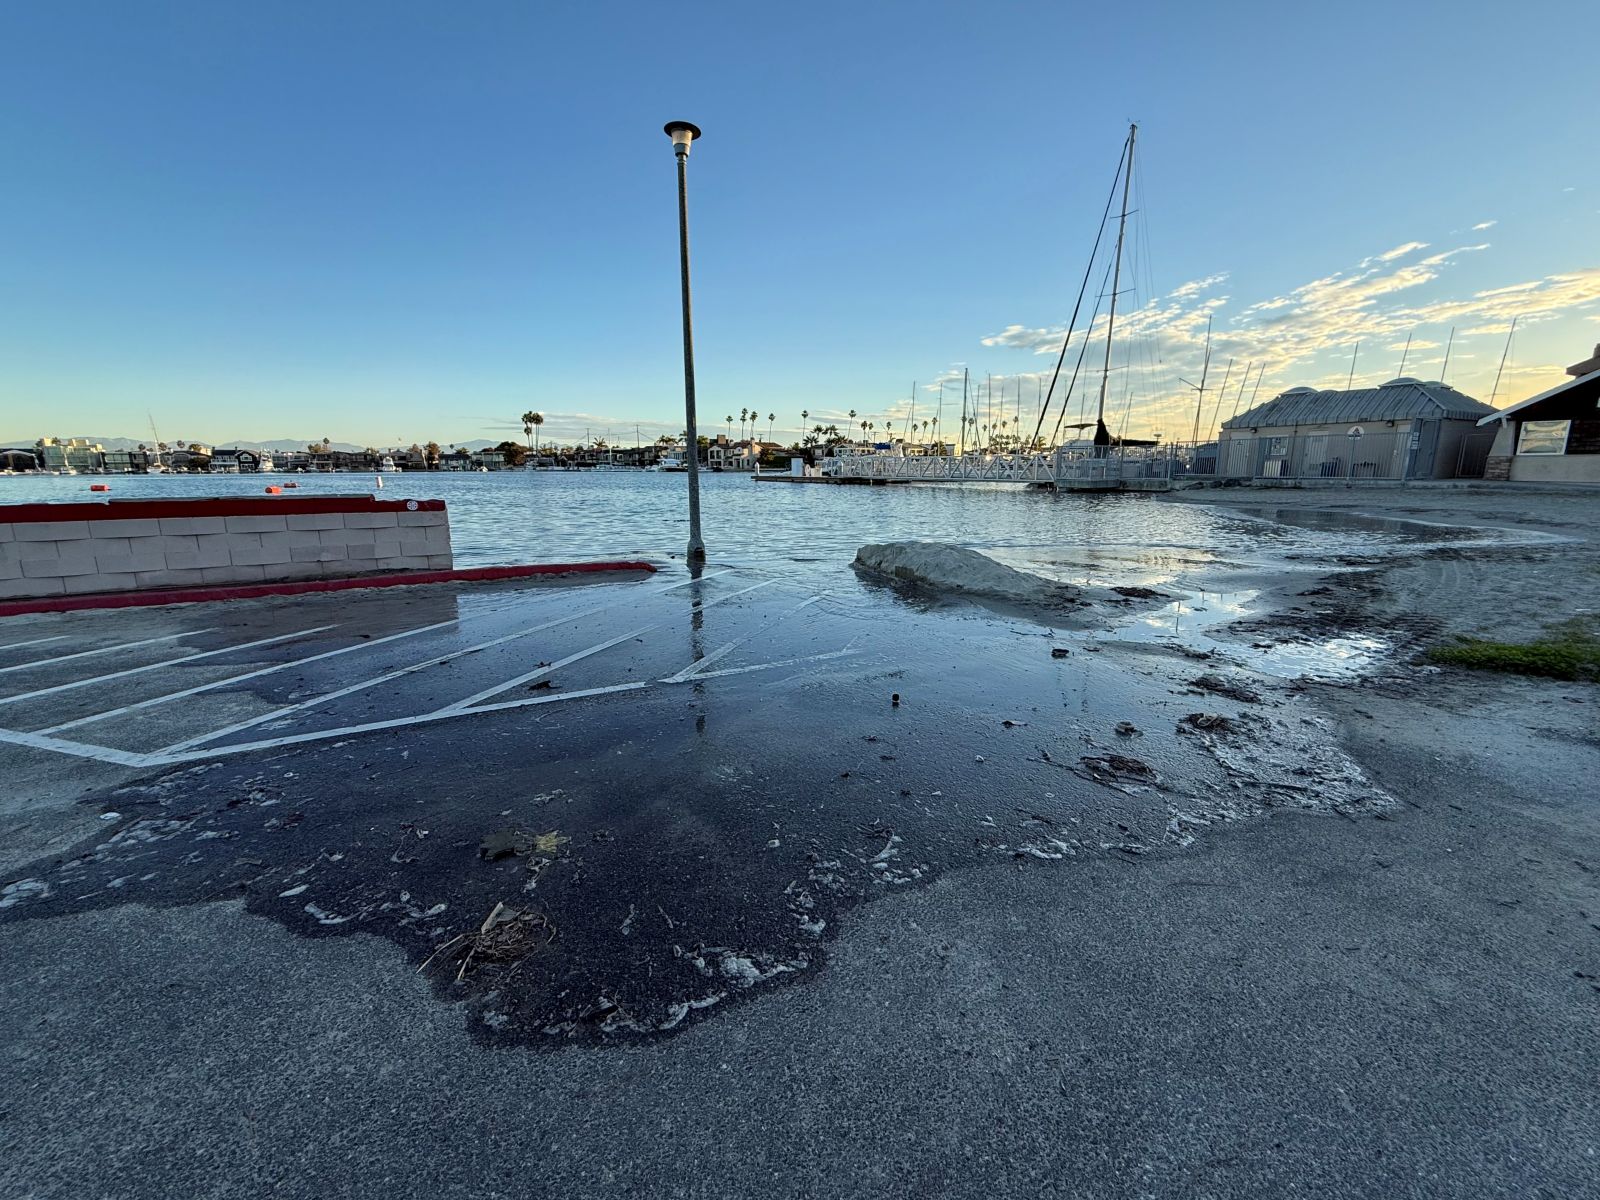
Port Royal Marina, Redondo Beach, 12/4/2025
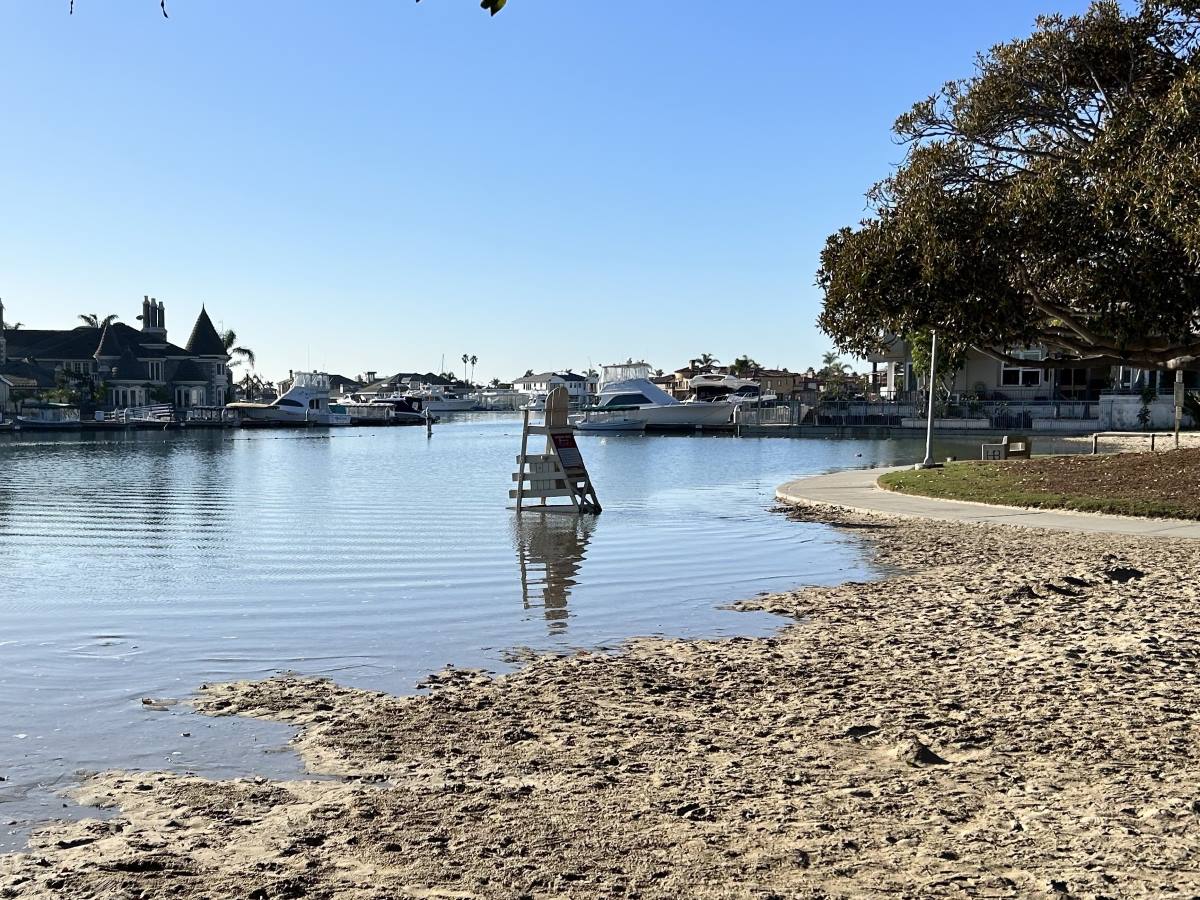
63rd Place at Alamitos Bay, Long Beach, 11/16/2024
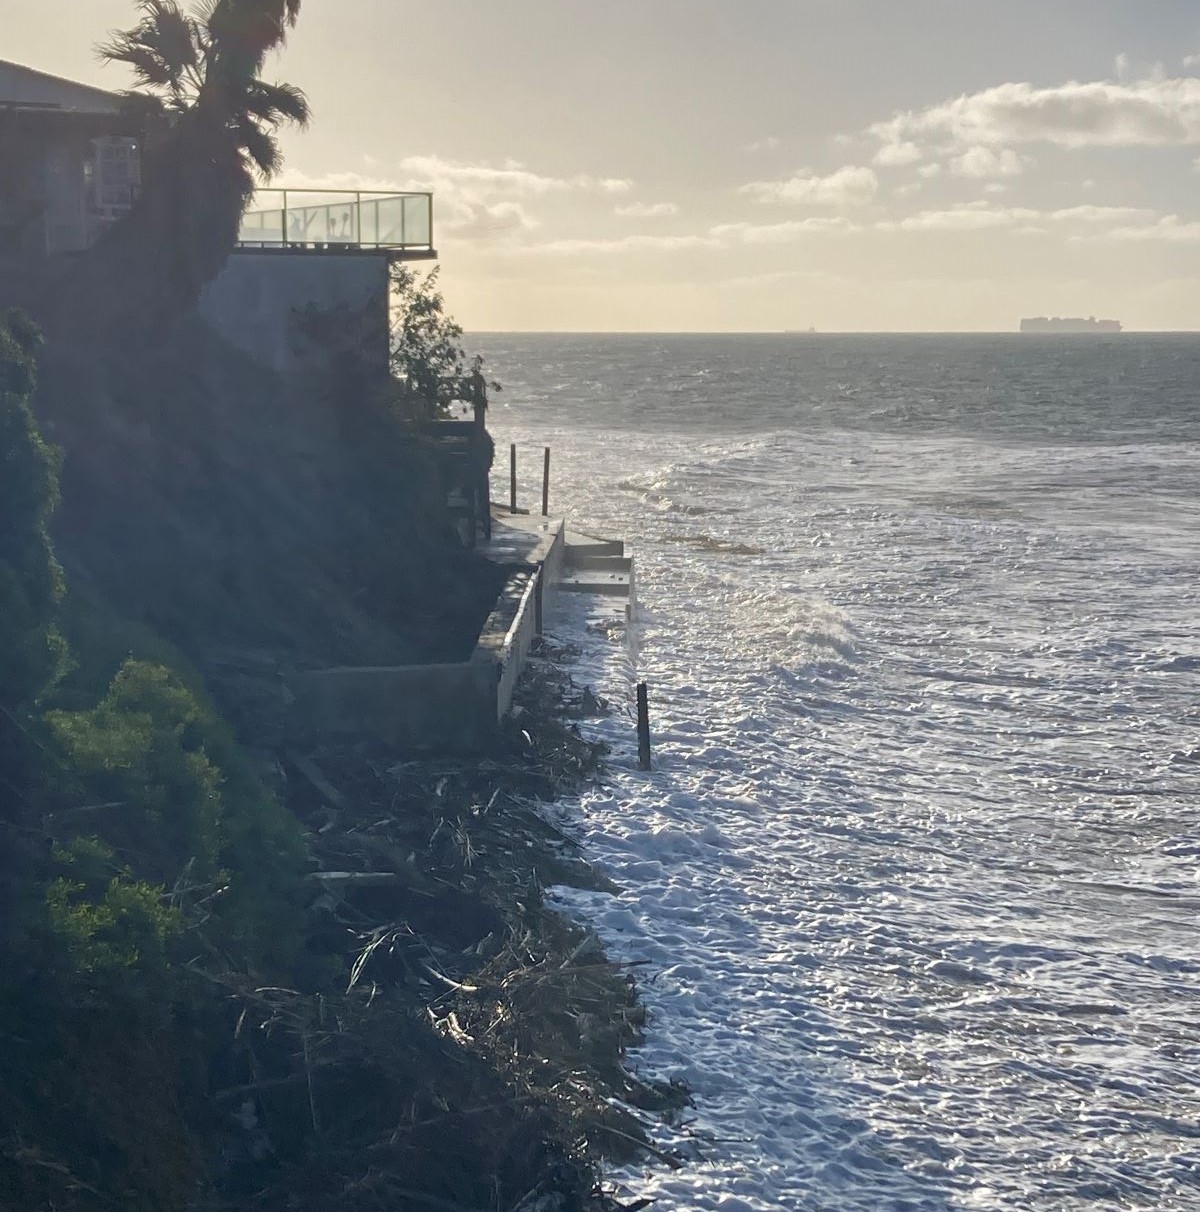
Broad Beach Road, Malibu, 11/17/2024
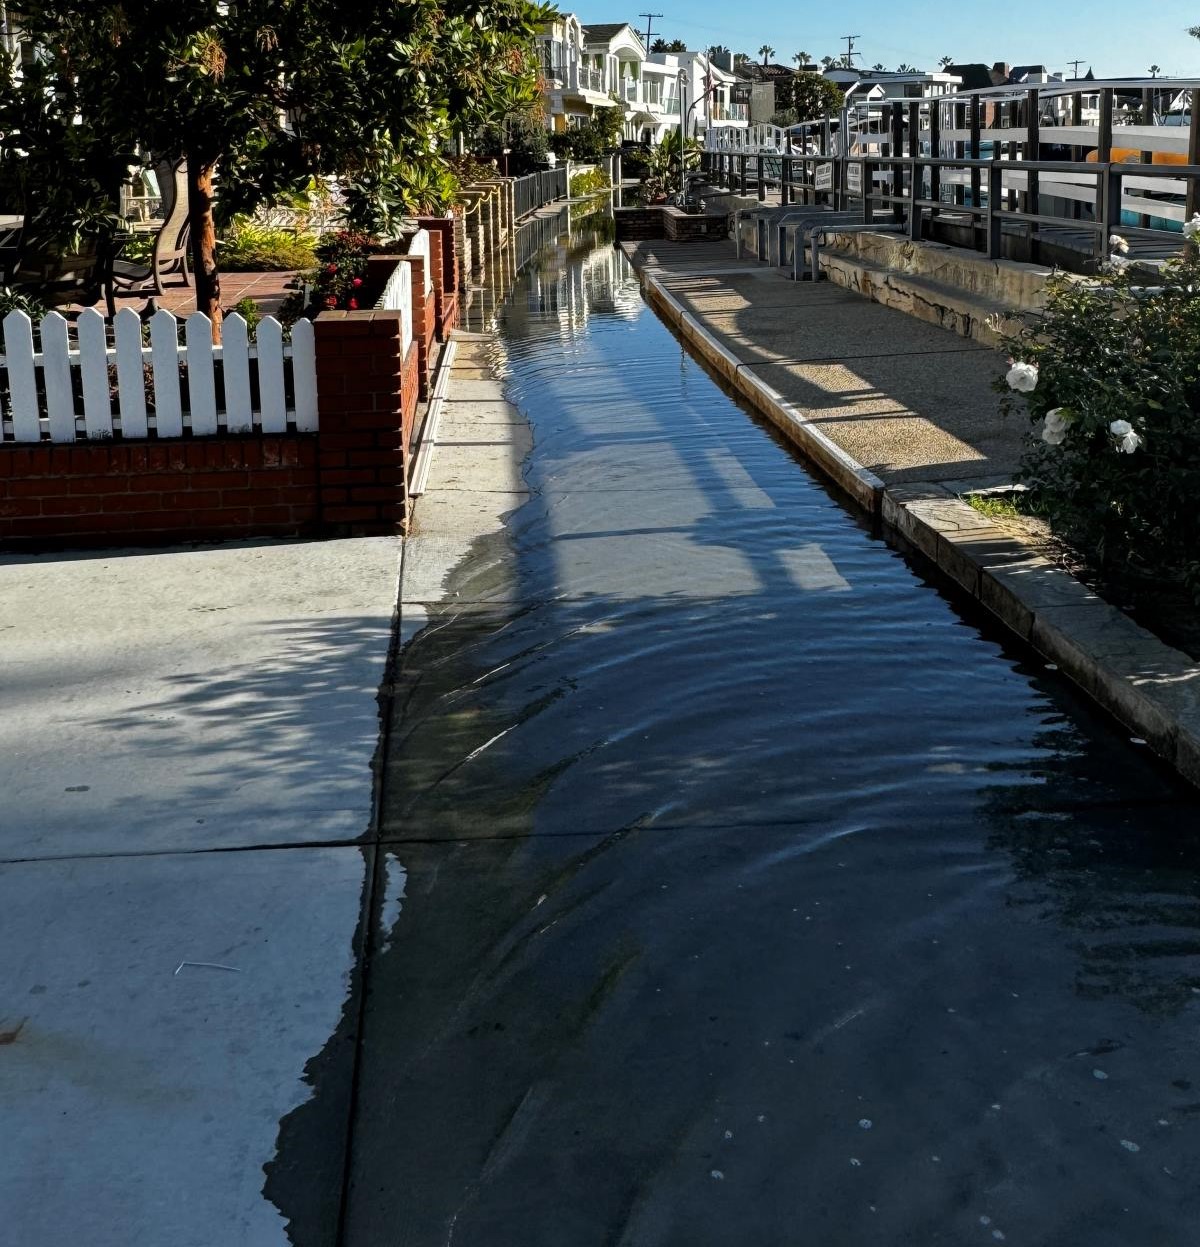
Rivo Alto Canal, Long Beach, 11/16/2024
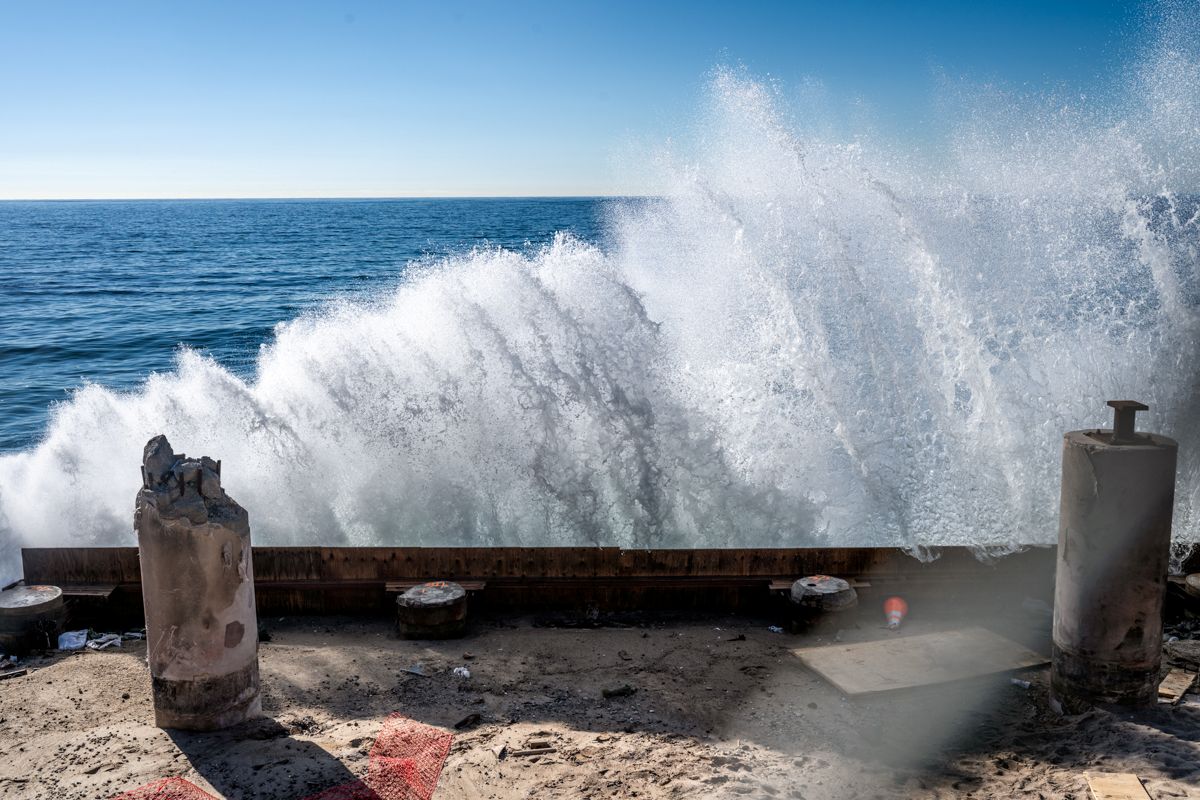
Paseo Del Mar, San Pedro, 11/15/2024
Fishermans Wharf, Redondo Beach, 11/16/2024

Brooks Street Beach, Laguna Beach, 11/15/2024
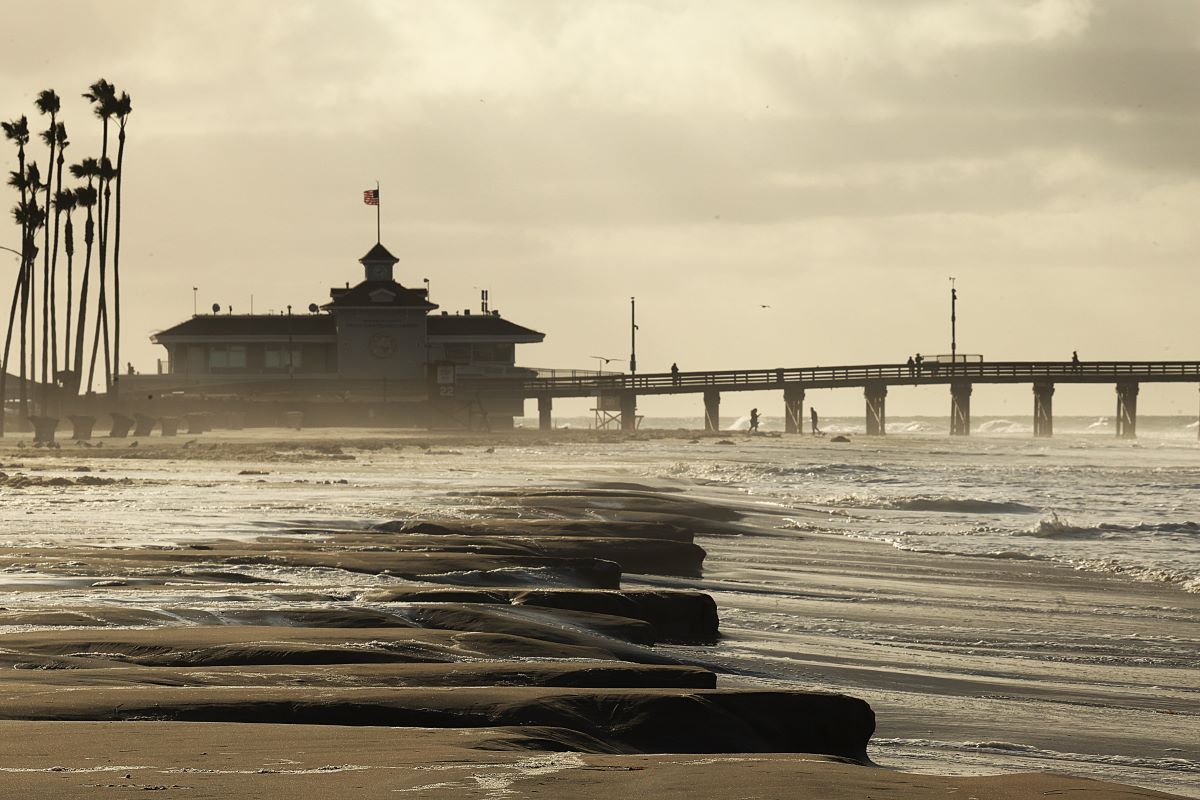
28th Street, Newport Beach, 11/15/2024
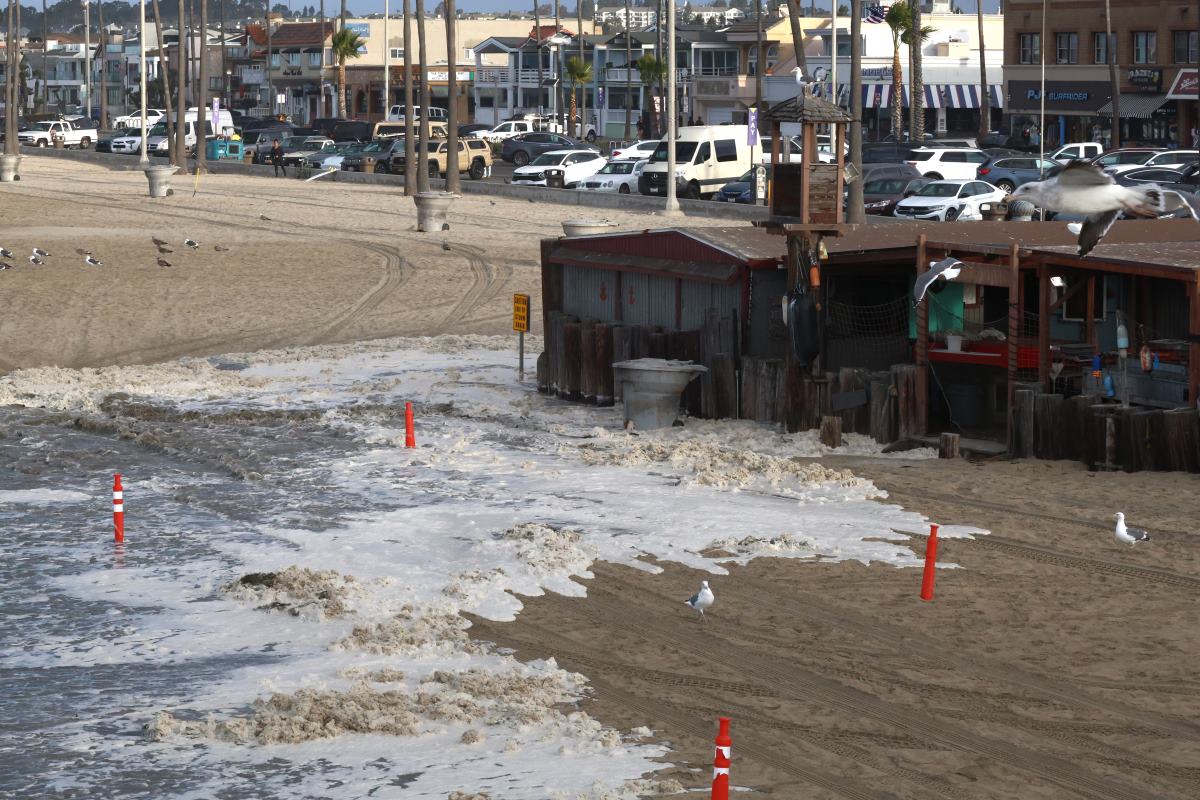
Market next to Pier, Newport Beach, 11/15/2024

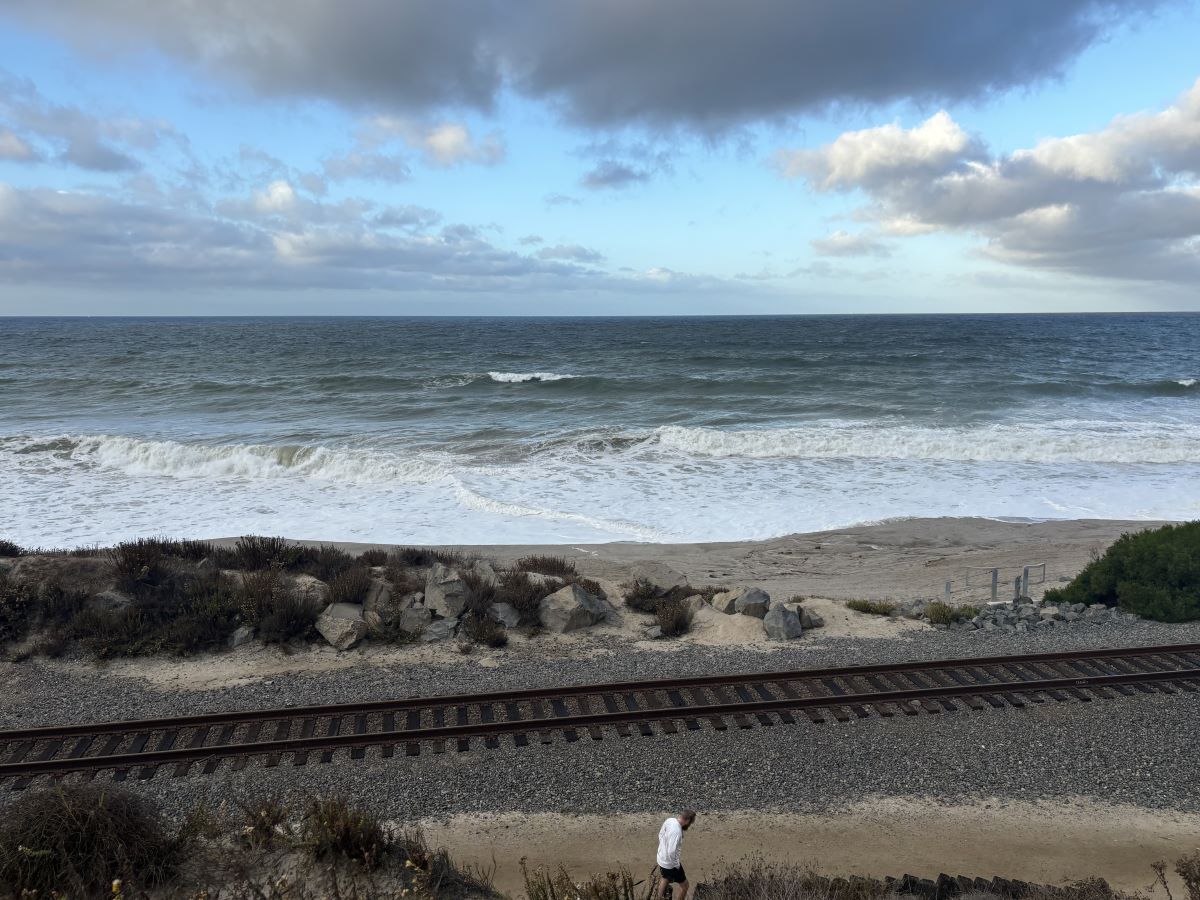
Calafia access, San Clemente State Beach, 11/16/2024
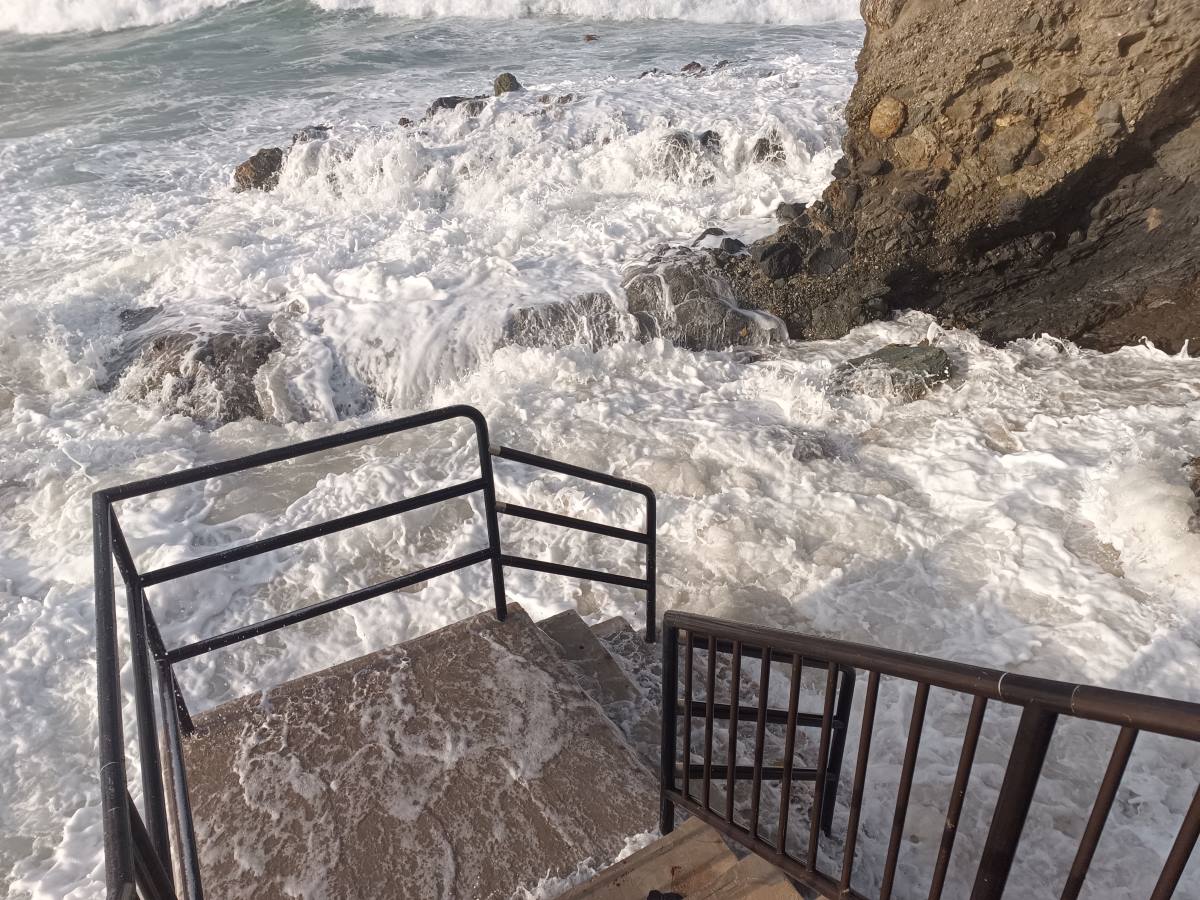
Cress Street Beach, Laguna Beach, 11/15/2024
Seabridge Park, Huntington Beach, 11/16/2024
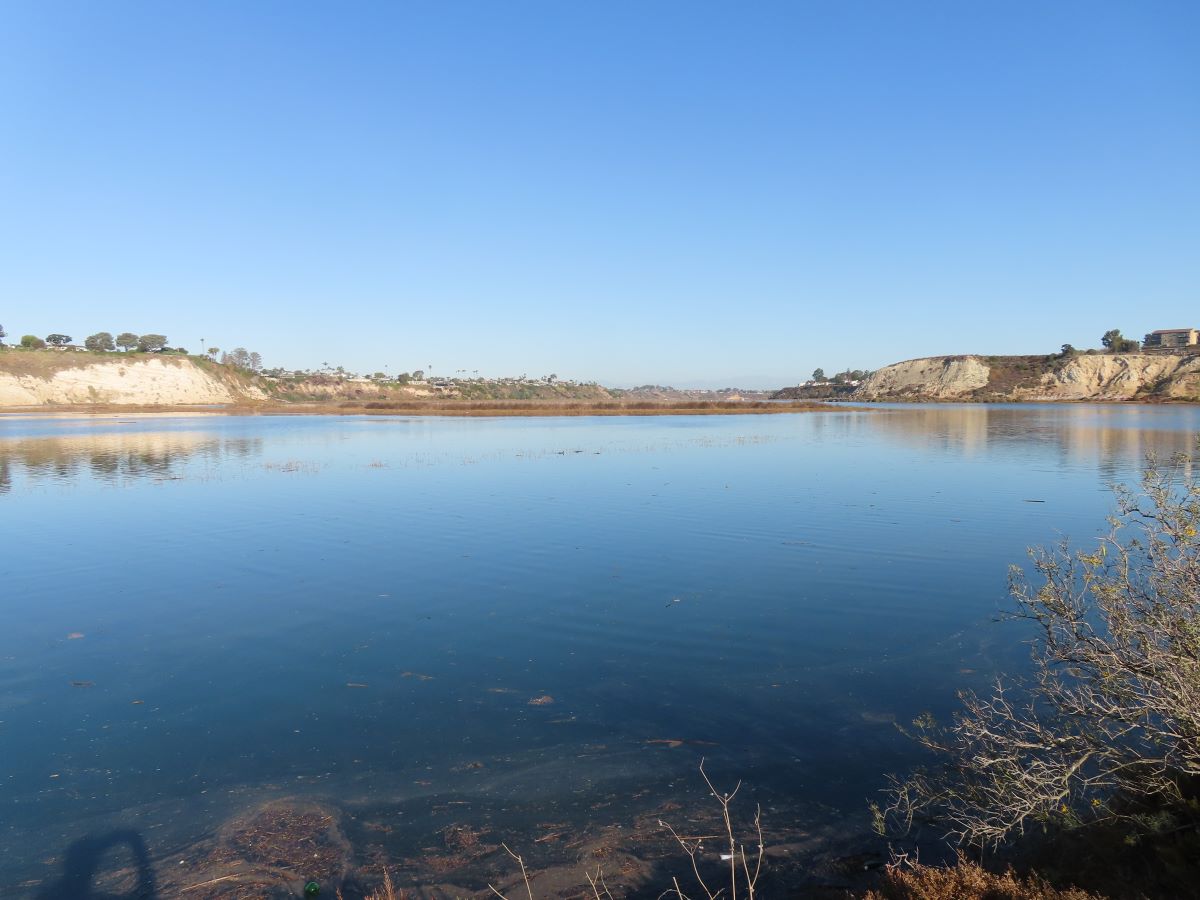
Back Bay Road, Newport Bay, 11/16/2024
San Clemente State Beach, 11/15/2024
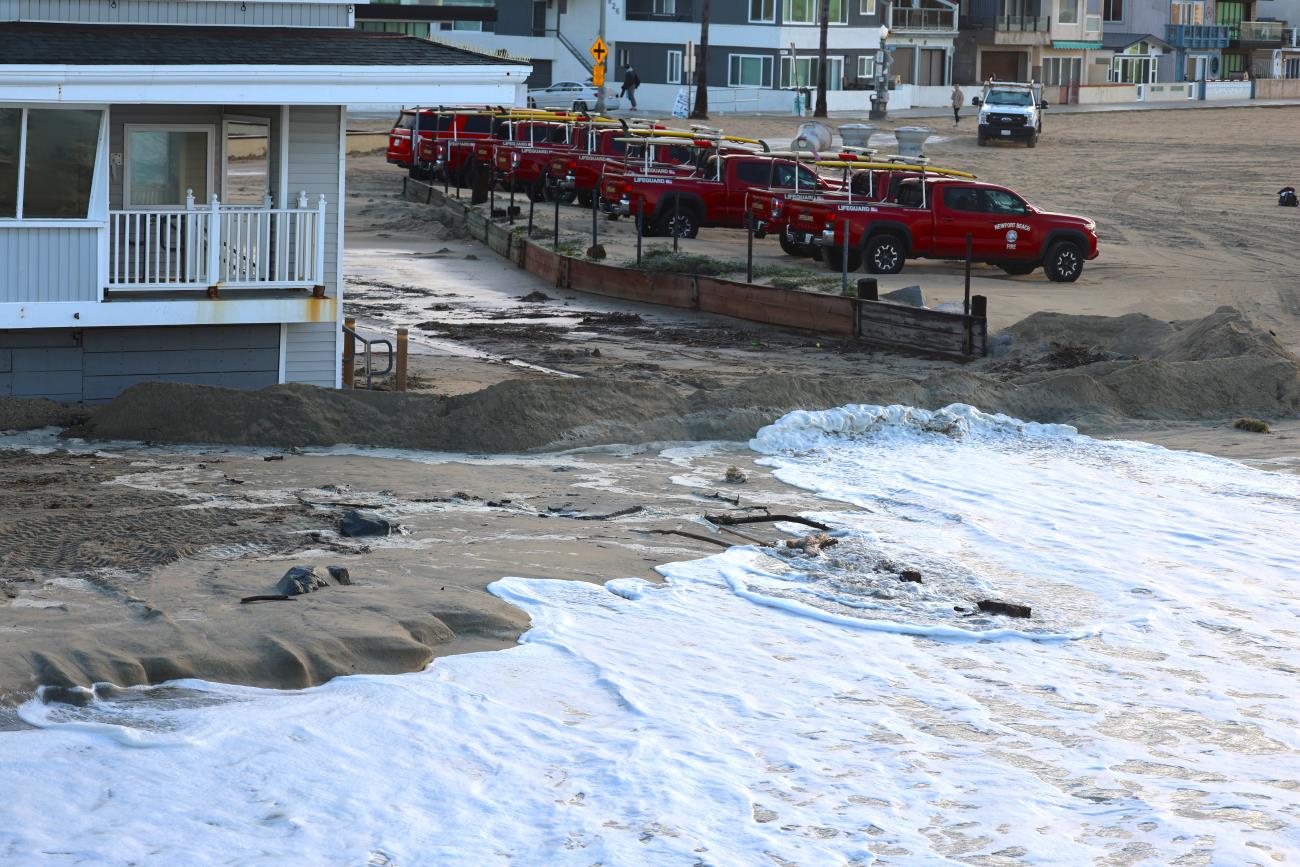
Lifeguard station, Newport Beach, 2/9/2024
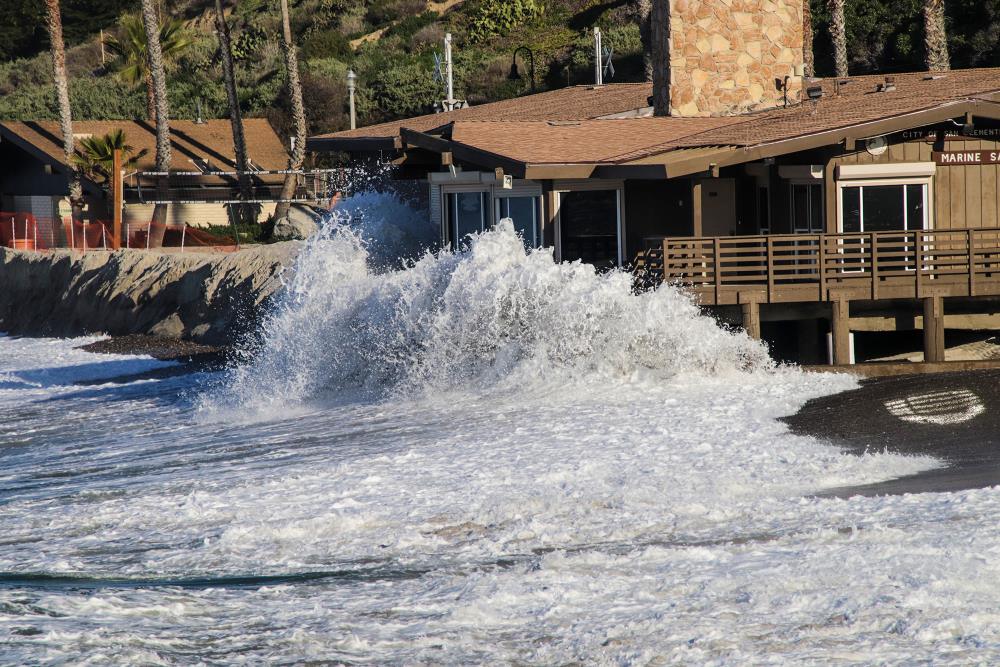
Marine Safety Building, San Clemente, 1/22/2023
Poche Beach, Dana Point, 12/23/22
Flag Point, Laguna Beach, 12/2024/22
Balboa Island ferry landing, 12/2024/22
Harbor at Sunset Beach along PCH, Huntington Beach, 12/23/22
Bayshore Bikeway between Pond 10 and Pond 10A, Imperial Beach, 12/5/2025
Shelter Island, San Diego, 12/4/2025
North Ponto State Beach, Carlsbad, 1/4/2026
Coronado Cays, Coronado, 12/5/2025
Taramar Beach, Carlsbad, 1/4/2026
Carlsbad Campground, Carlsbad, 1/4/2026
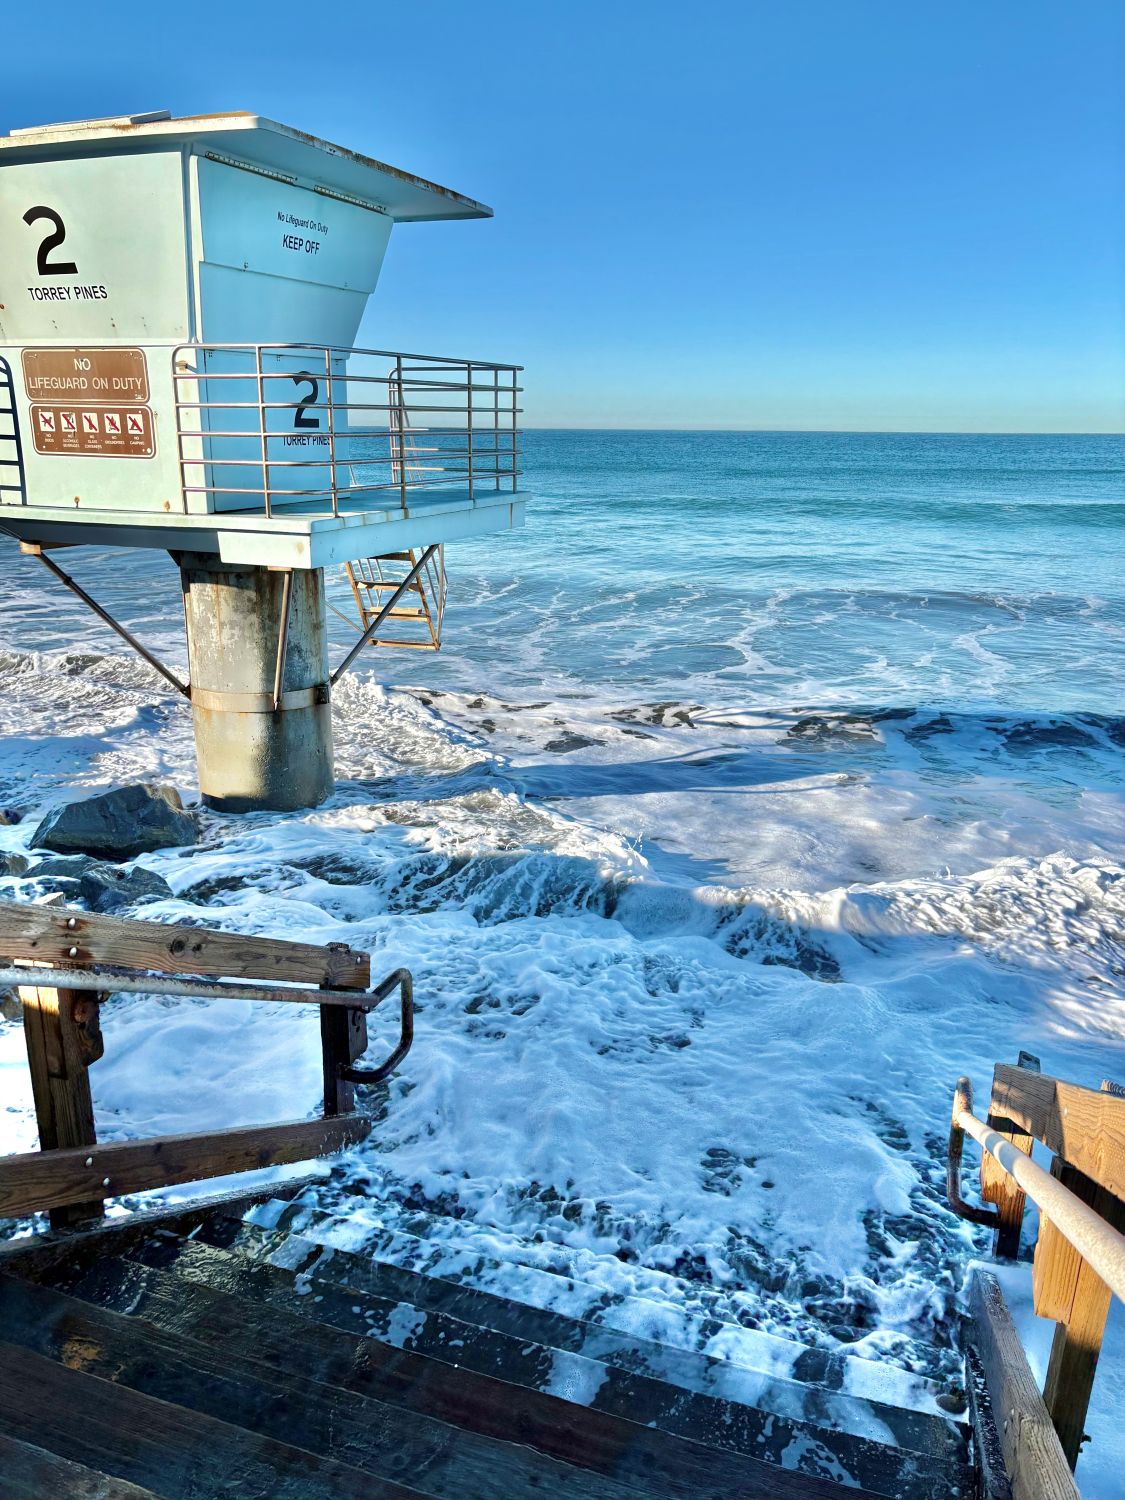
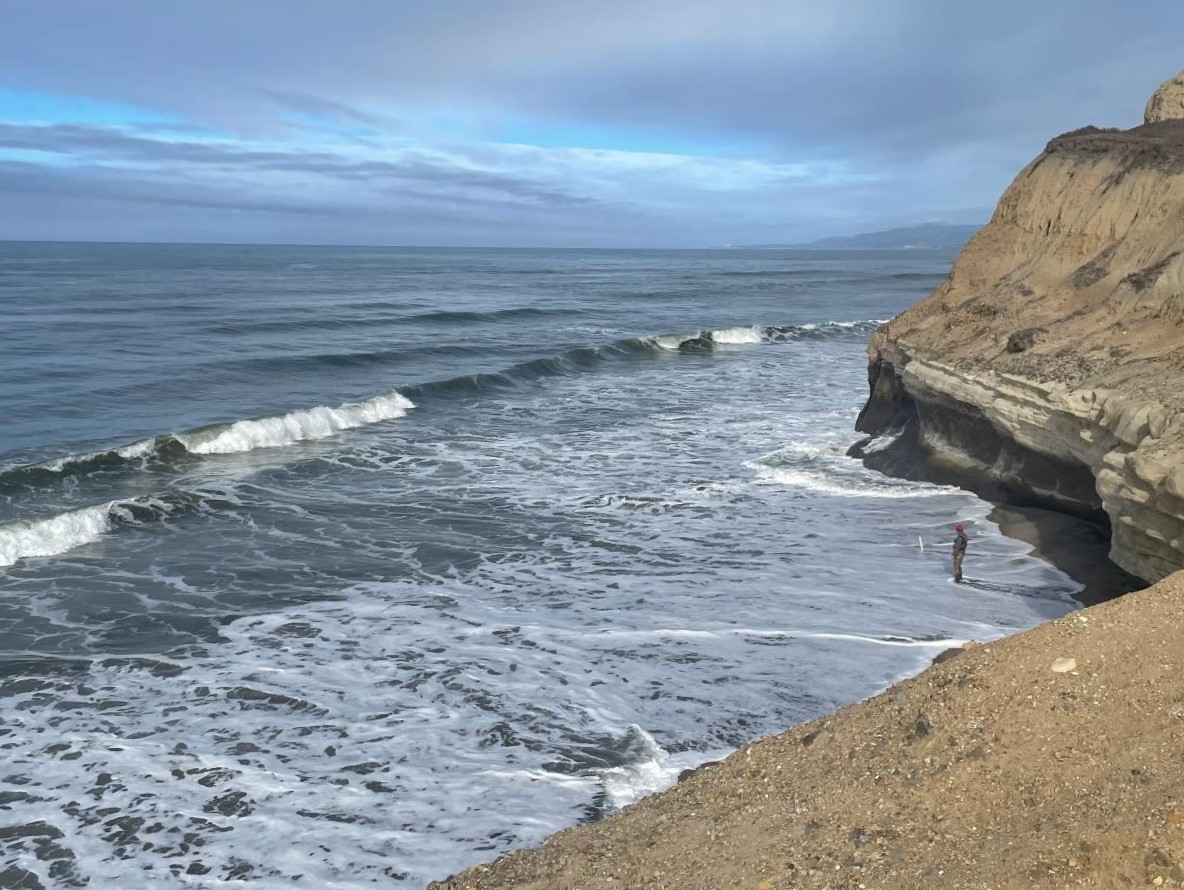
Torrey Pines South Beach, La Jolla, 12/5/2025

Cardiff State Beach, 11/15/2024

Del Mar, 11/15/2024
Pacific Beach, 11/15/2024
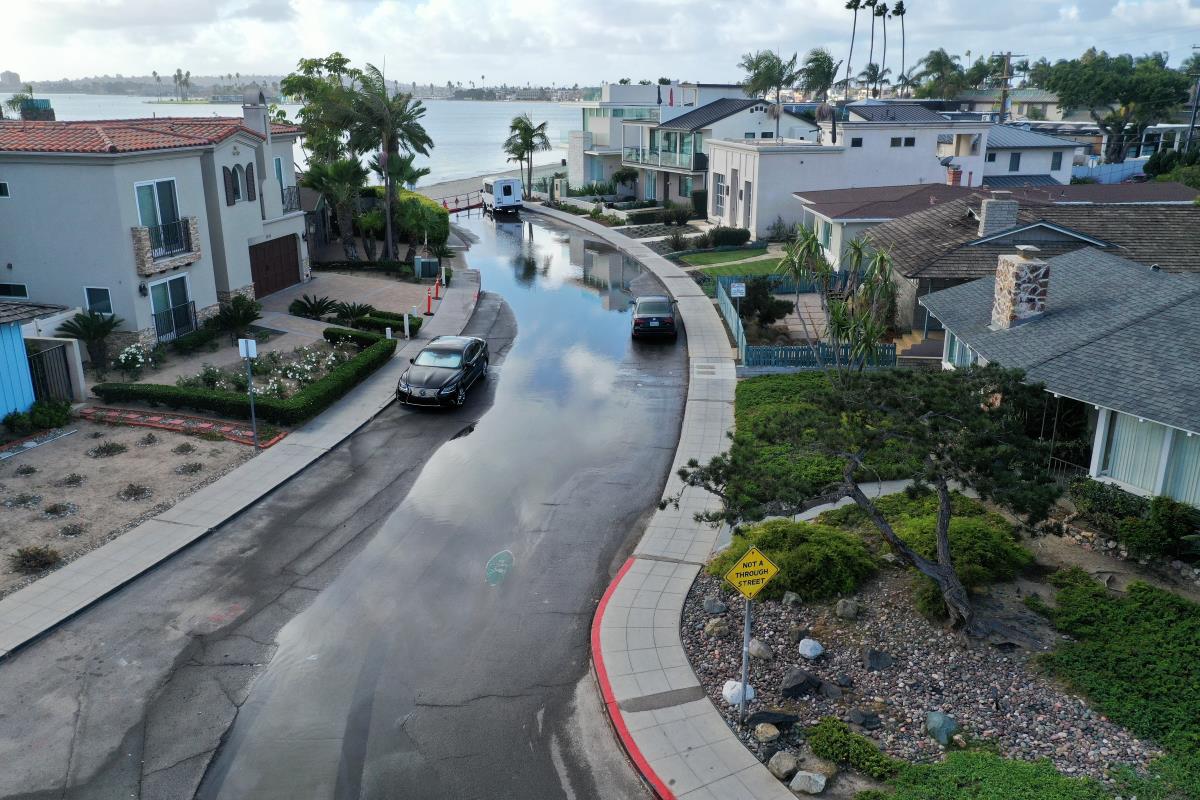
Pacific Beach, 11/15/2024
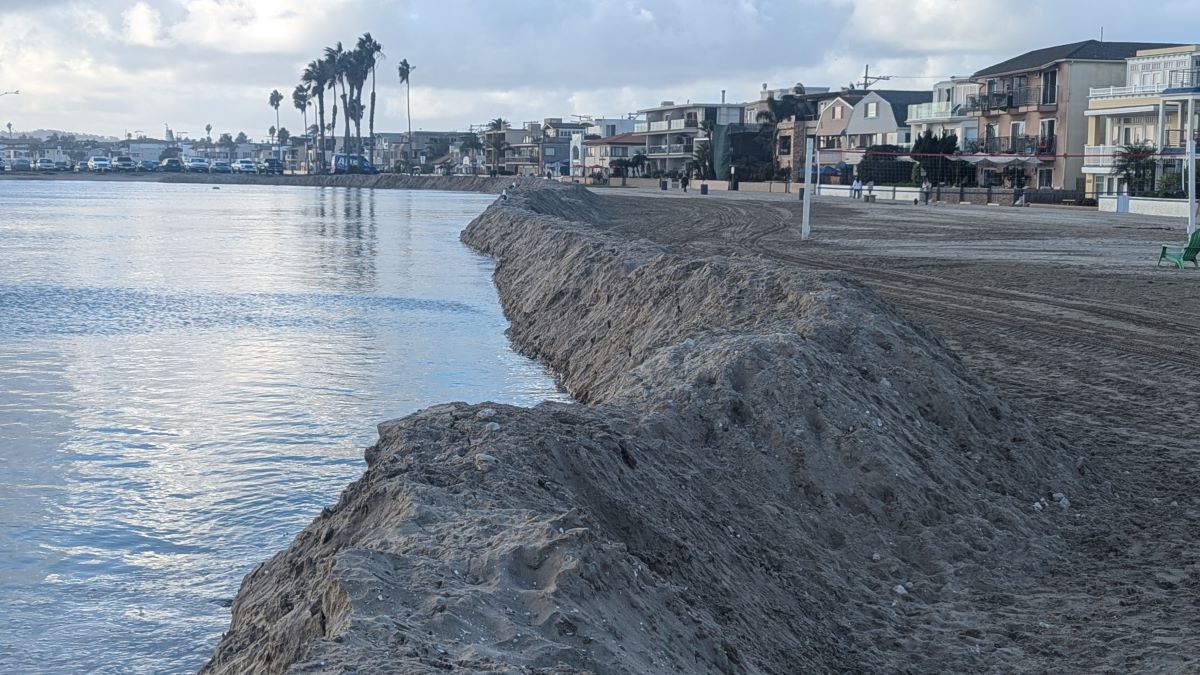
San Juan Cove, San Diego, 11/15/2024
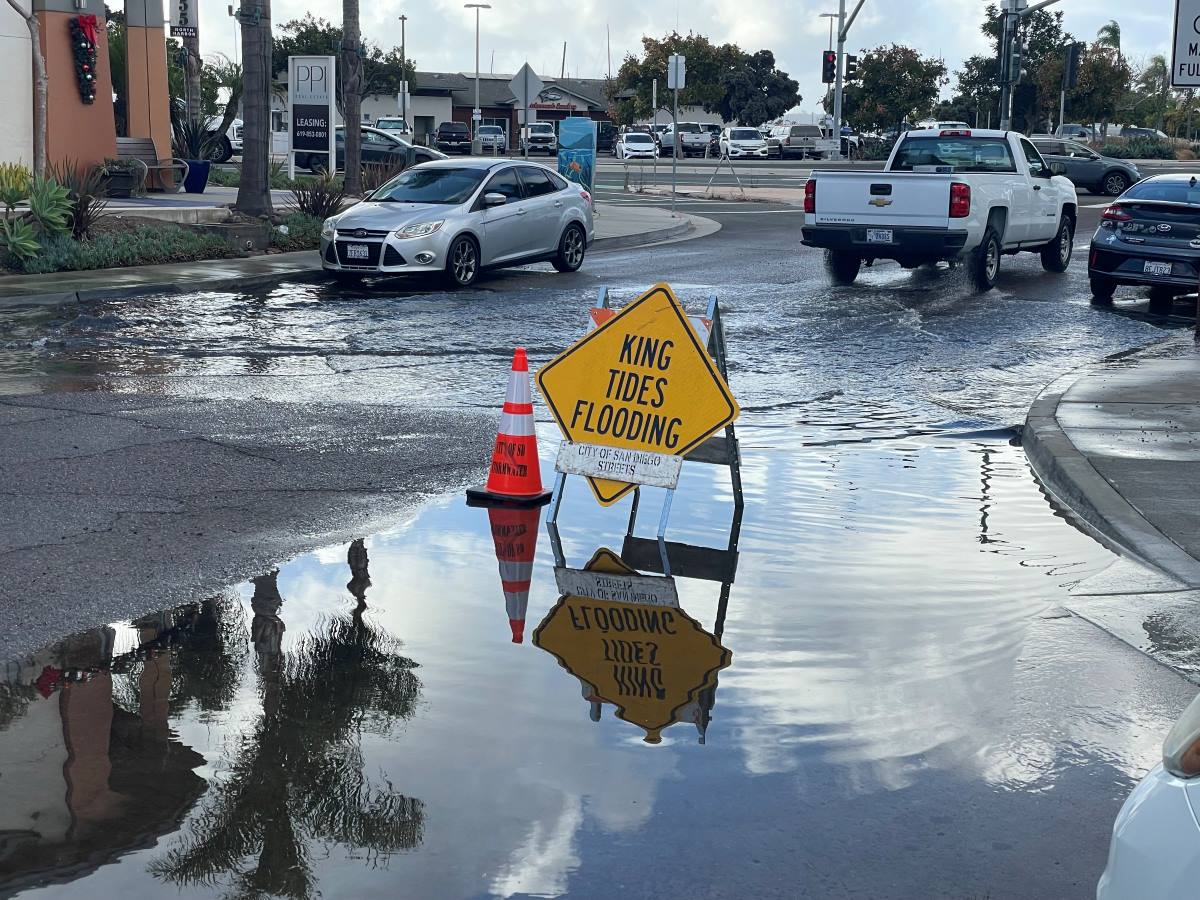
Scott Street and N. Harbor Drive, San Diego, 11/15/2024

Seacoast Drive, Imperial Beach, 2 hours after peak tide, 11/16/2024
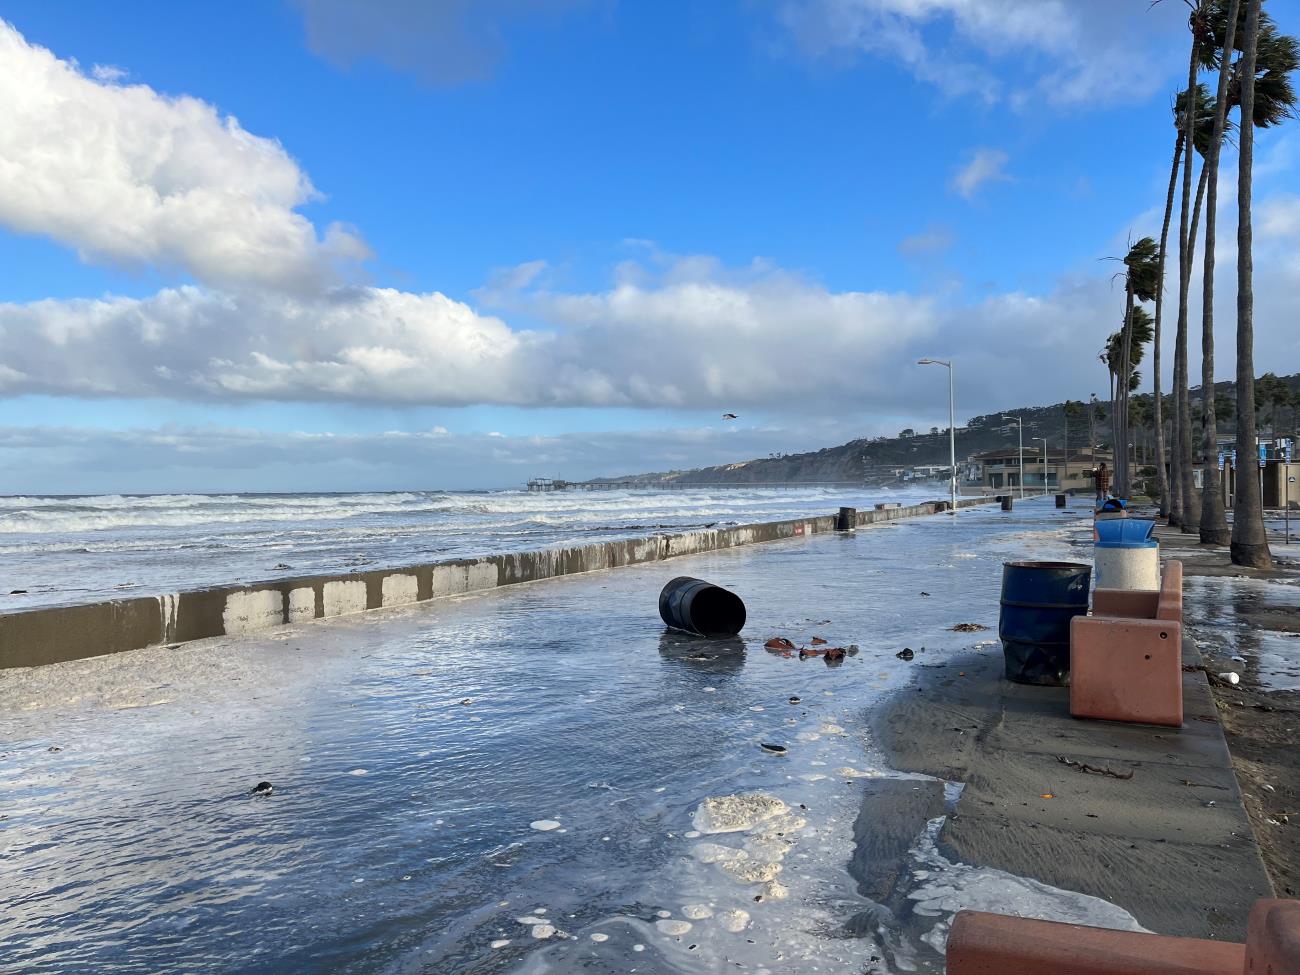
El Paseo Grande & Camino del Oro, La Jolla Shores, 1/11/2024
Foot of Hayes, South Oceanside, 2/9/2024
Join #KingTides on social media:
![]()
![]()
![]()