Many of our state’s coastal waters — rivers, creeks, lakes, lagoons, bays, estuaries, and the ocean — are degraded or threatened by polluted runoff, which can harm aquatic and terrestrial ecosystems, public health, and the local economy. Polluted runoff — also known as nonpoint source (NPS) pollution — is generated by a variety of land use activities, including urban development, agriculture, and forestry.
Numerous local and regional groups are active in water quality protection and restoration efforts in California’s coastal watersheds. In addition, most cities have polluted runoff control programs, and 28 state agencies have responsibilities for implementing the state’s NPS Program.
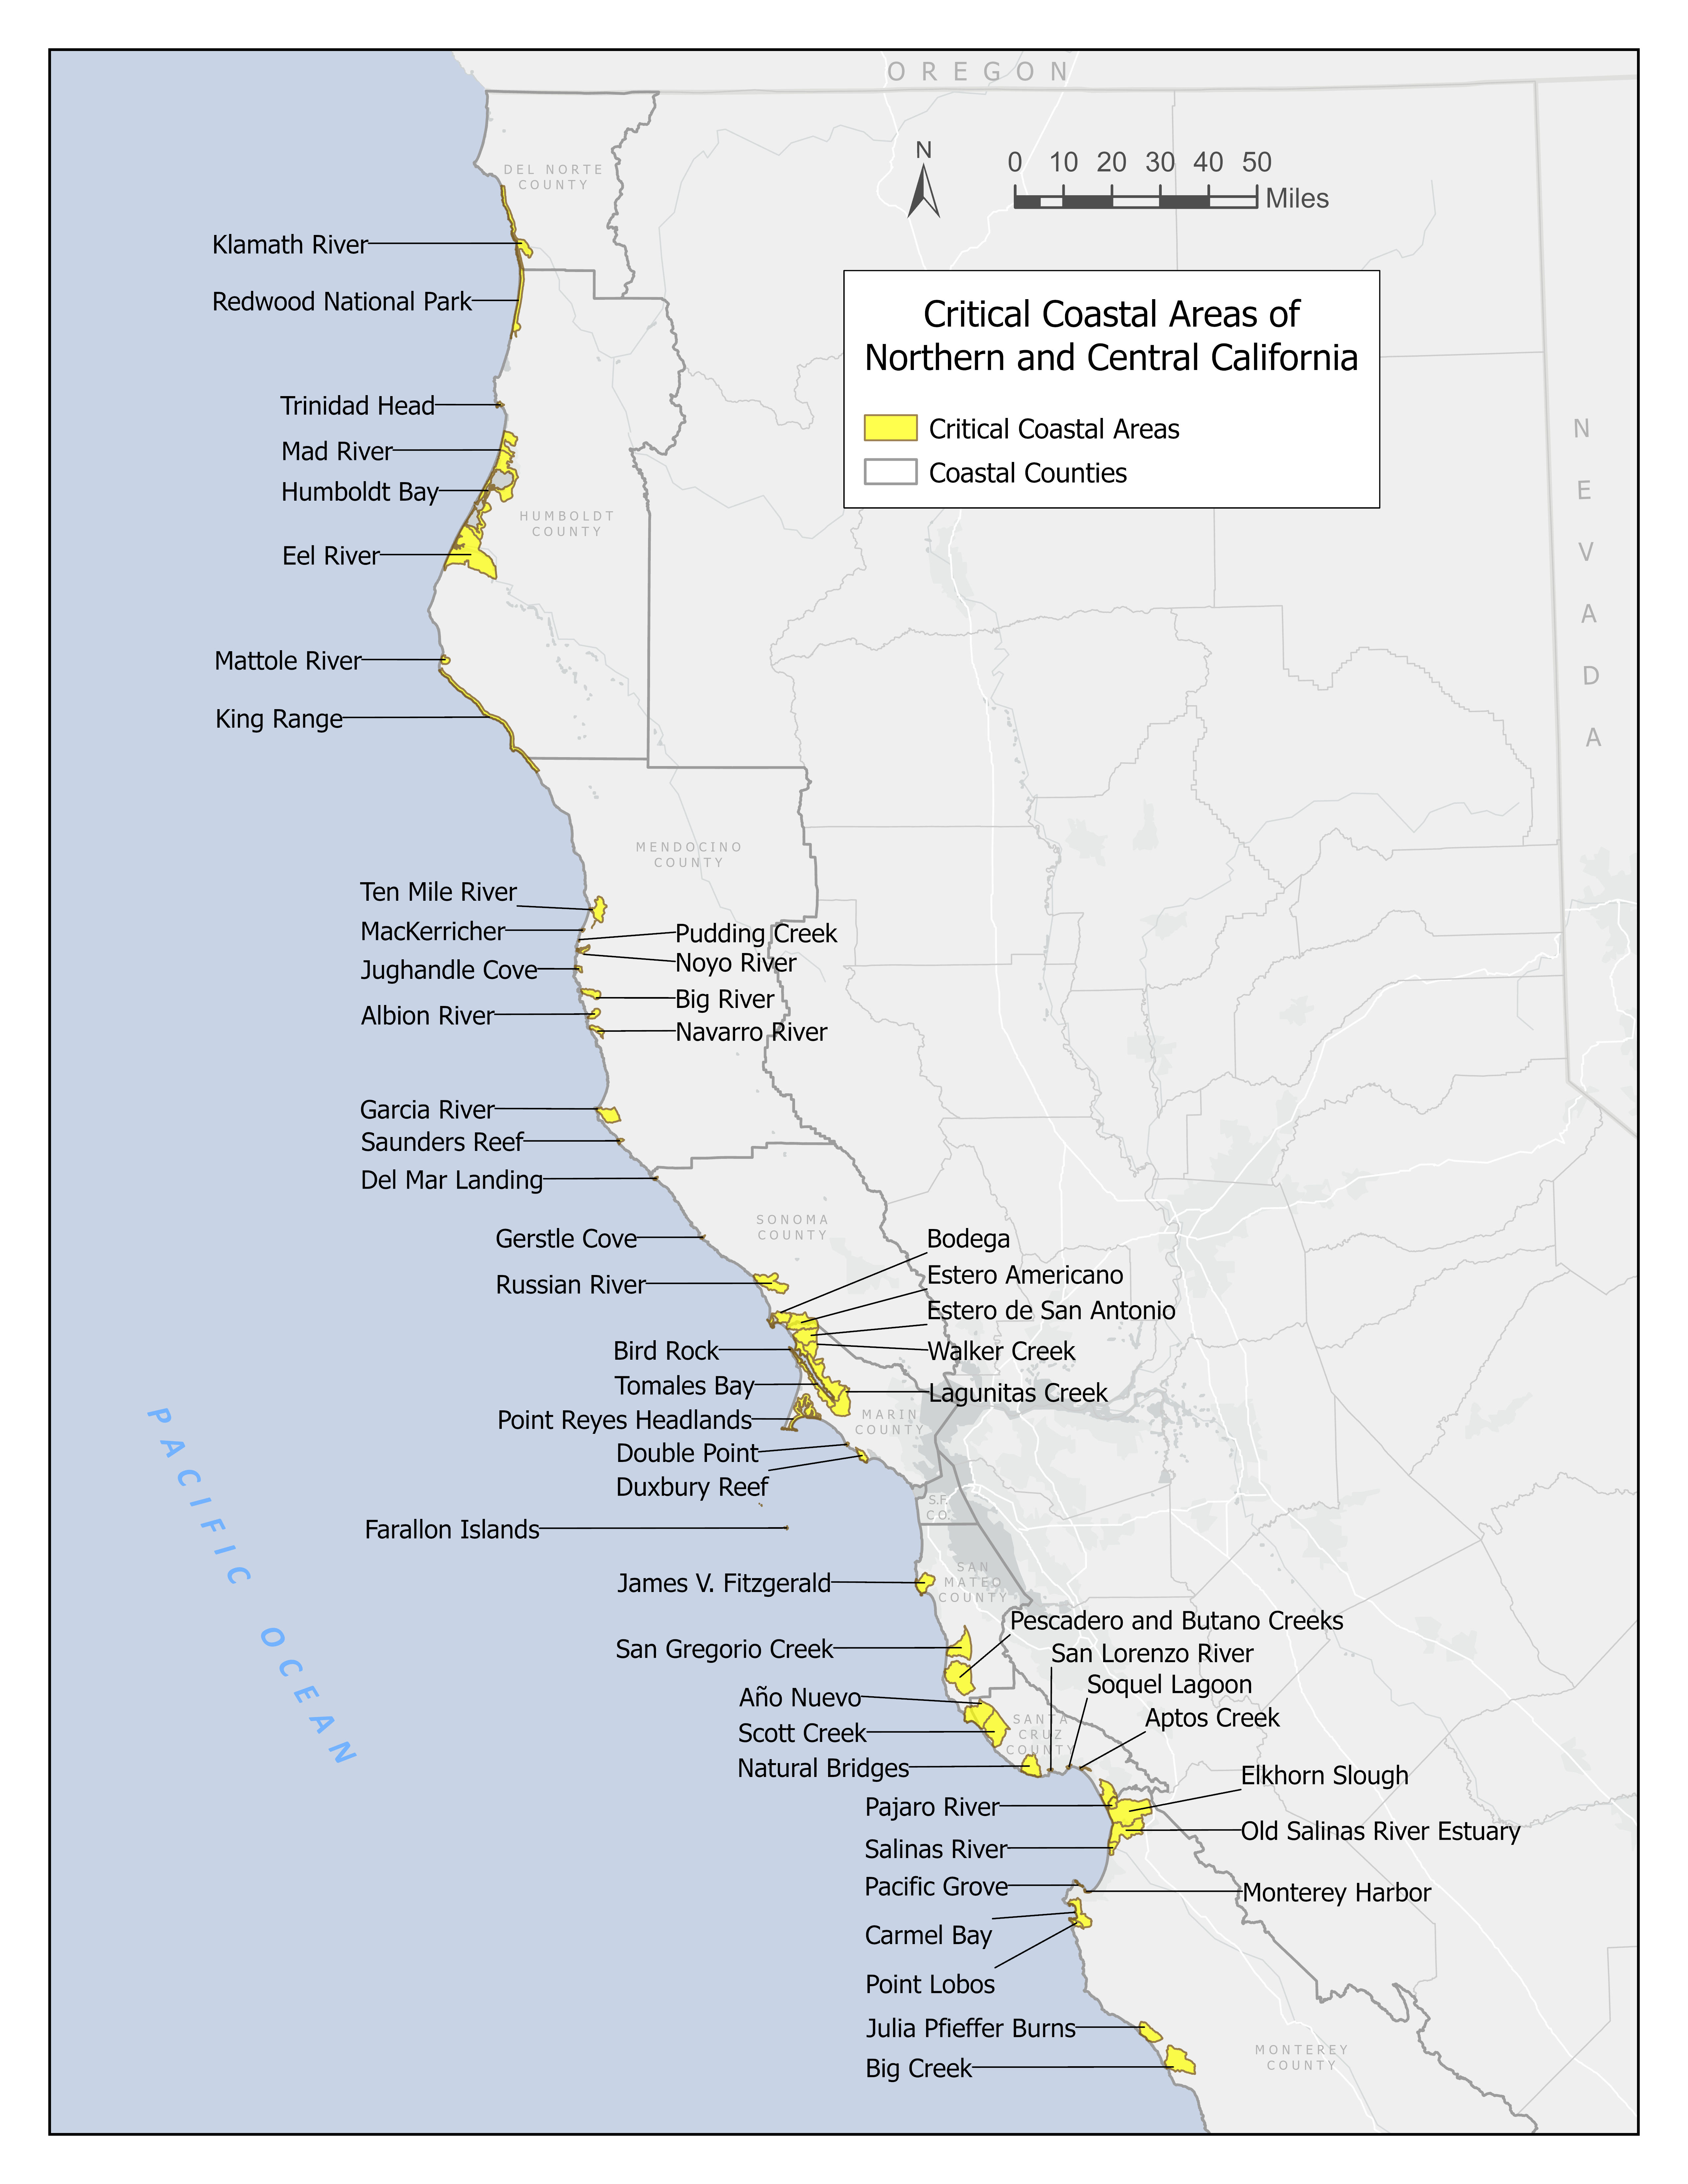
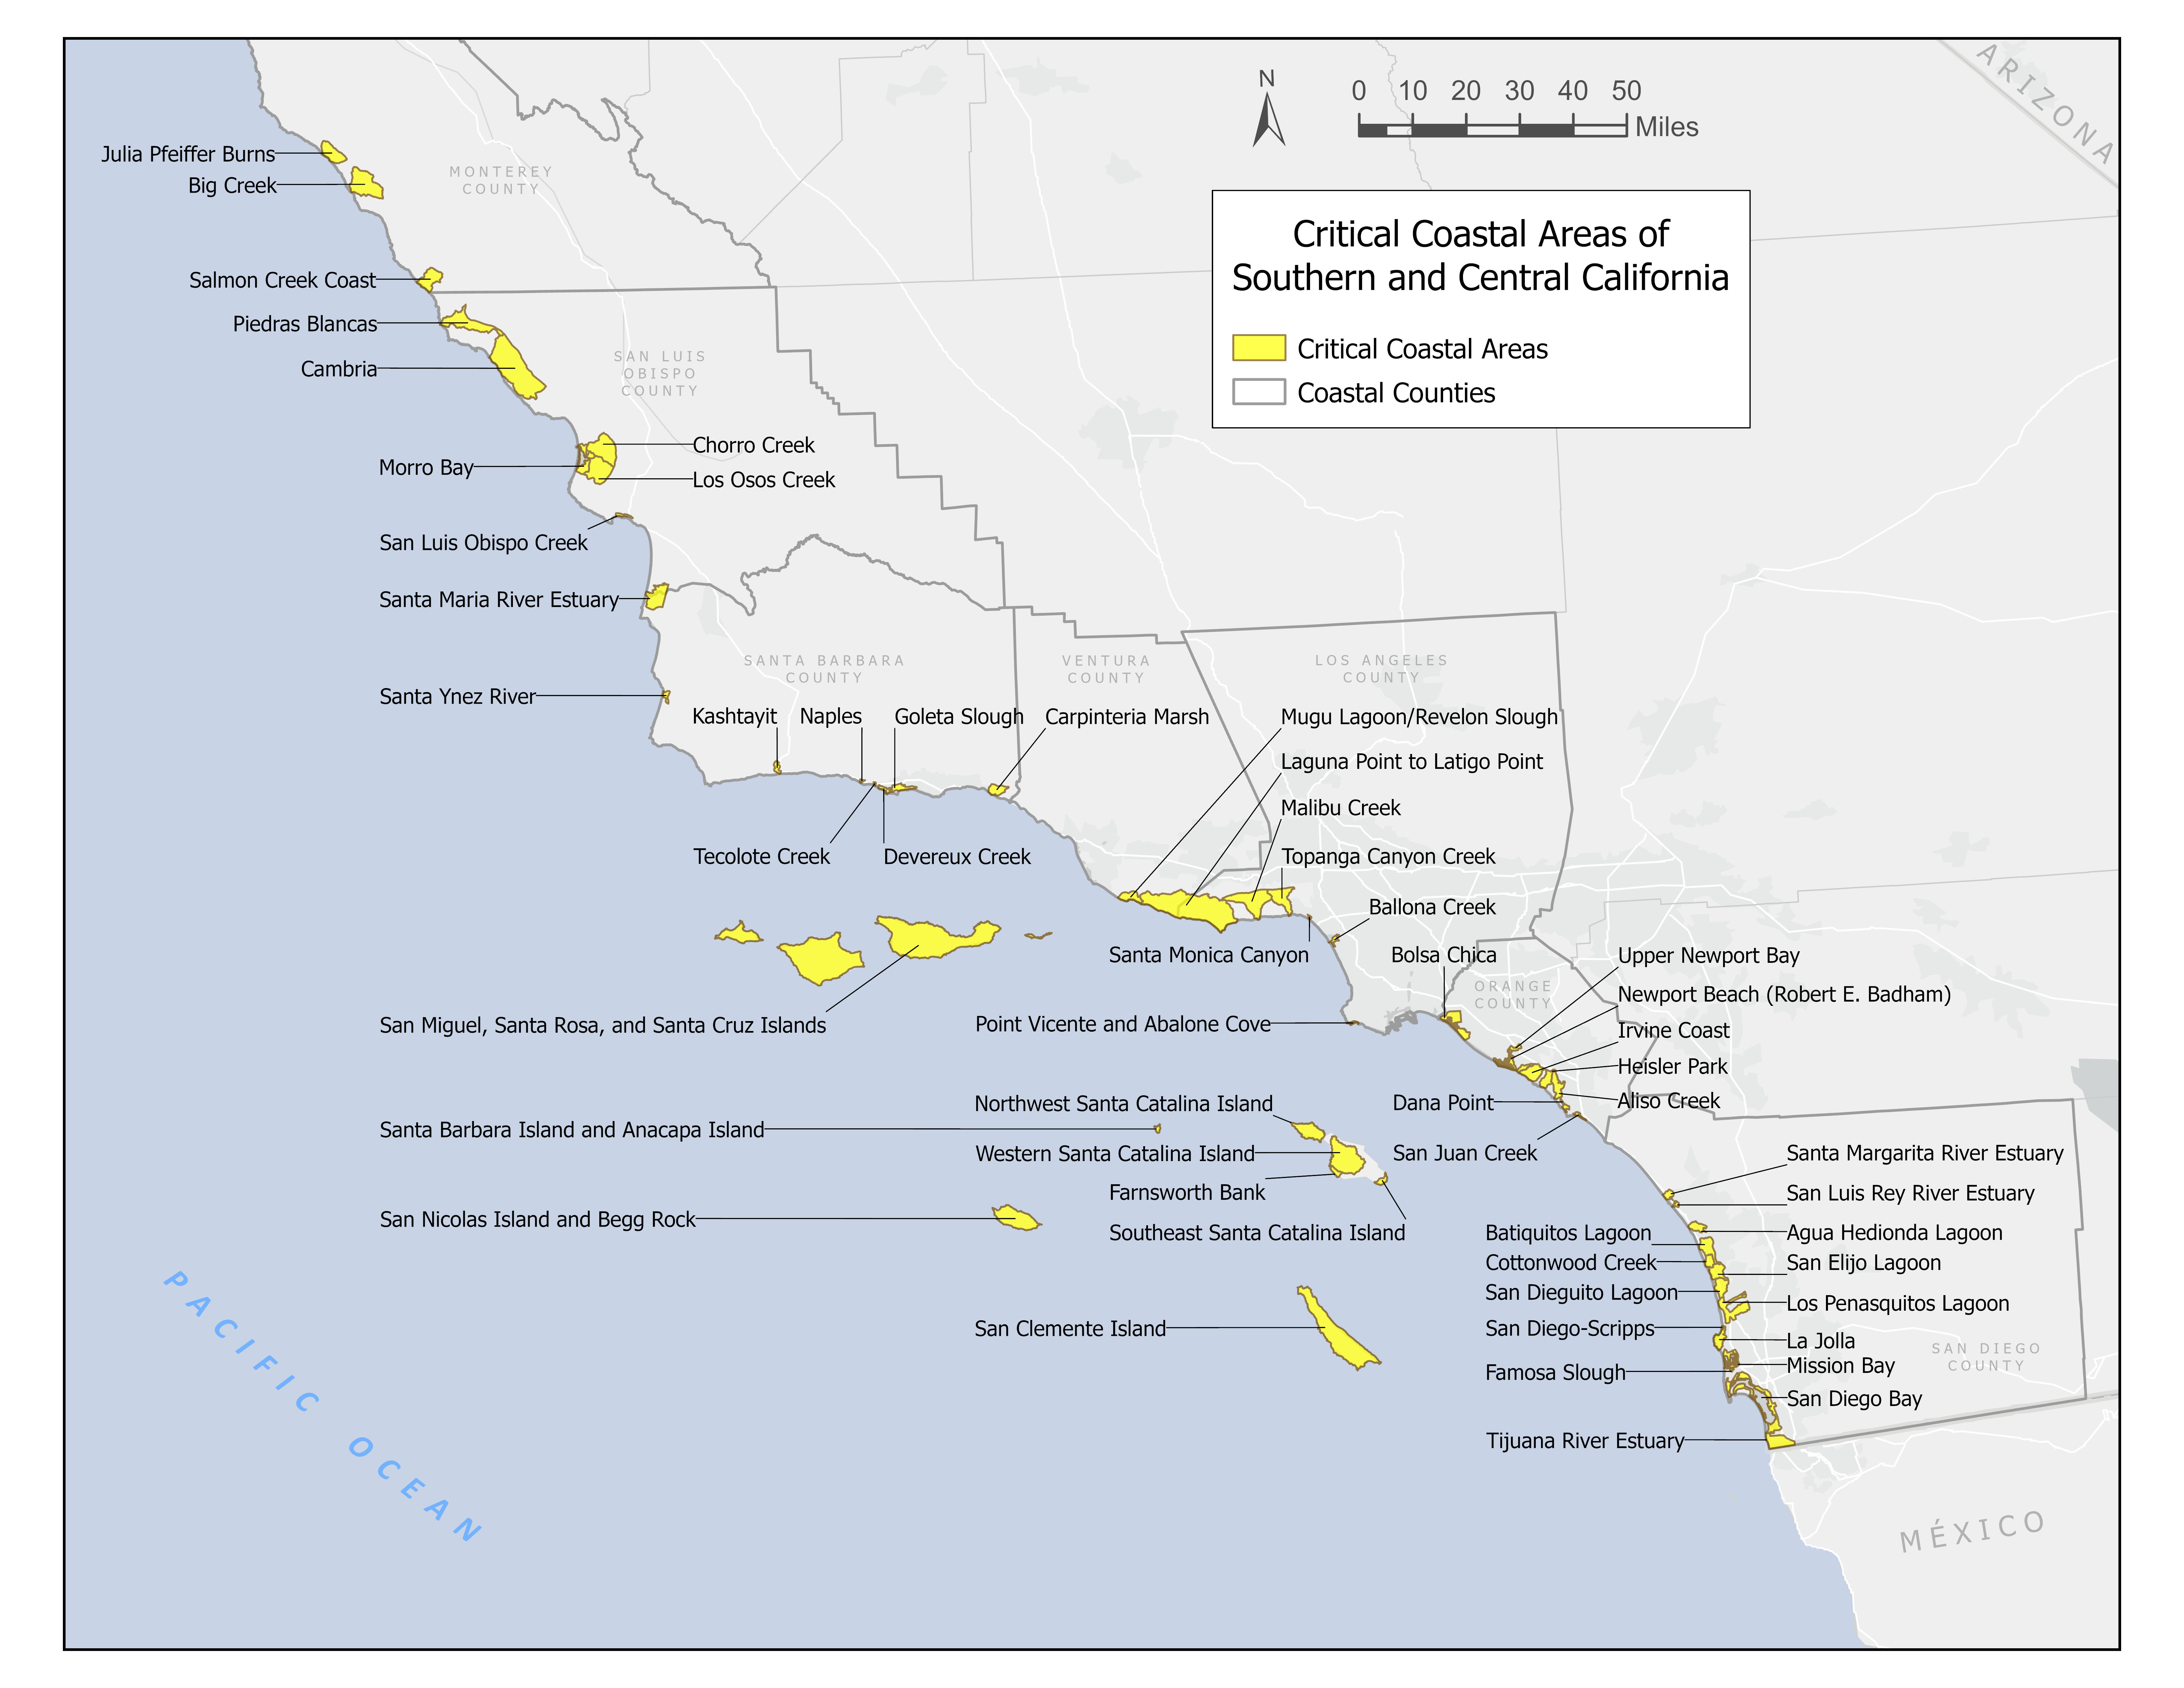
California’s Critical Coastal Areas (CCA) program aims to foster collaboration among local stakeholders and government agencies, to better coordinate efforts to protect high resource-value coastal waters from polluted runoff. This non-regulatory program, which is part of the state’s NPS Program, is coordinated by Coastal Commission staff.
This online GIS-based map viewer shows the location & boundaries of each CCA, plus relevant information, including:
Please see the factsheet on How to Use the CCA Map Viewer Here.
The criteria used to identify coastal watersheds as Critical Coastal Areas reflect the dual goals of improving degraded coastal water quality, and providing extra protection from polluted runoff to coastal waters with recognized high resource value. The multi-agency Statewide CCA Committee selected initial criteria for identifying CCAs in 1995, and added new criteria in 2002 and 2014, Using the established CCA identification criteria, five additional CCAs were identified in 2024 based on newly listed impaired waterbodies on the state’s 2020-2022 Clean Water Act 303(d) list of impaired waters. One additional CCA was also identified in 2025 based on the 2022-2024 303(d) list of impaired waters. There are currently 104 CCAs identified within the Coastal Commission’s jurisdiction.
A factsheet was developed in Dec. 2019 for each CCA in the Coastal Commission’s jurisdiction at that time. (The five CCAs identified in 2024 do not yet have factsheets). Each factsheet includes a description of the CCA watershed, an overview of the land uses in the coastal watershed, the criterion used for CCA identification, a list of impaired waterbodies (indicating the pollutants) and potential pollutant sources in the CCA, and a photo of the CCA.